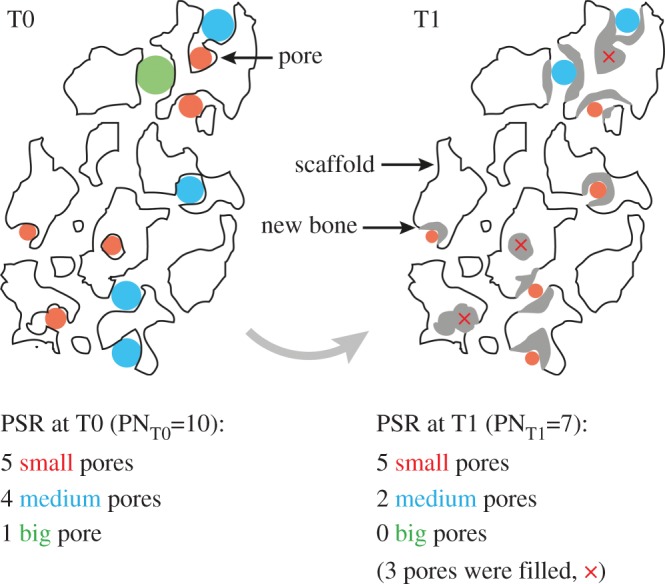
Figure 6.

Graphical representation of the idealized pore size range (PSR) of one single slice of a scaffold for time points T0 and T1. Pores and pore sizes are colour-coded. The scaffold’s outline is shown in black. Newly formed bone material is represented in grey. Since this is an idealized representation, not all pores and newly formed bone fillings are displayed. Comparing T0 and T1 showed that the total pore number (PN) decreases due to bone formation. In this example, only the number of big- and medium-sized pores were affected by the newly formed bone material—the amount of small pores did not change over time. Analysing each pore individually, however, showed that nearly all pores were affected by the bone formation.
