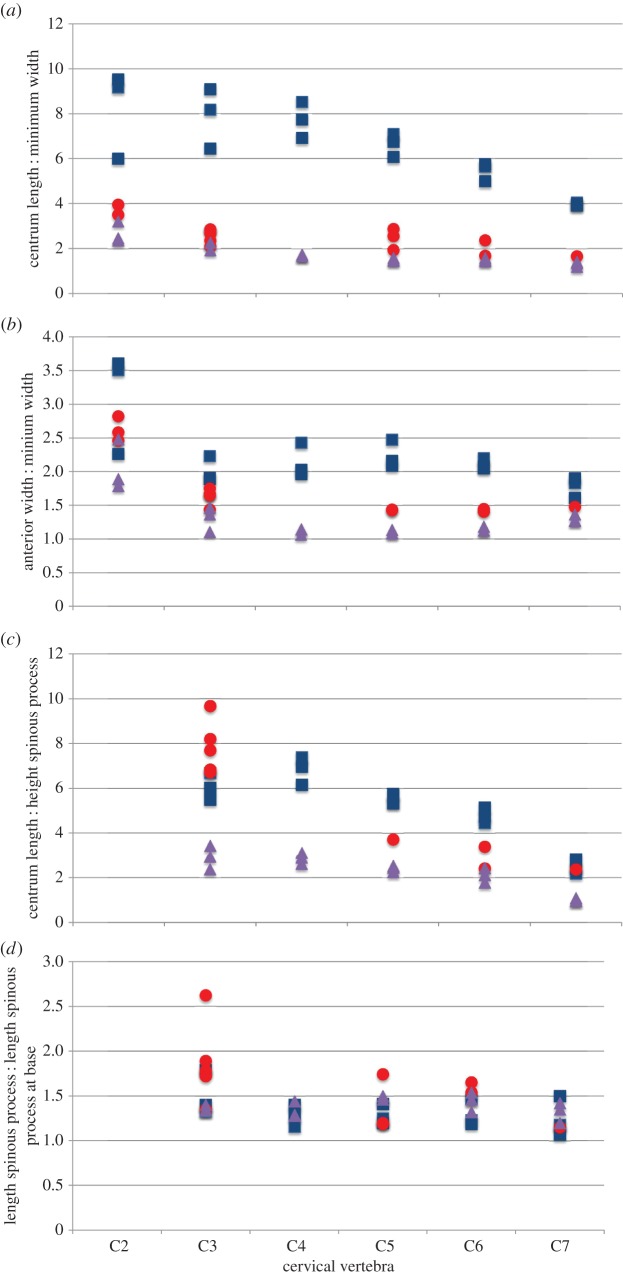
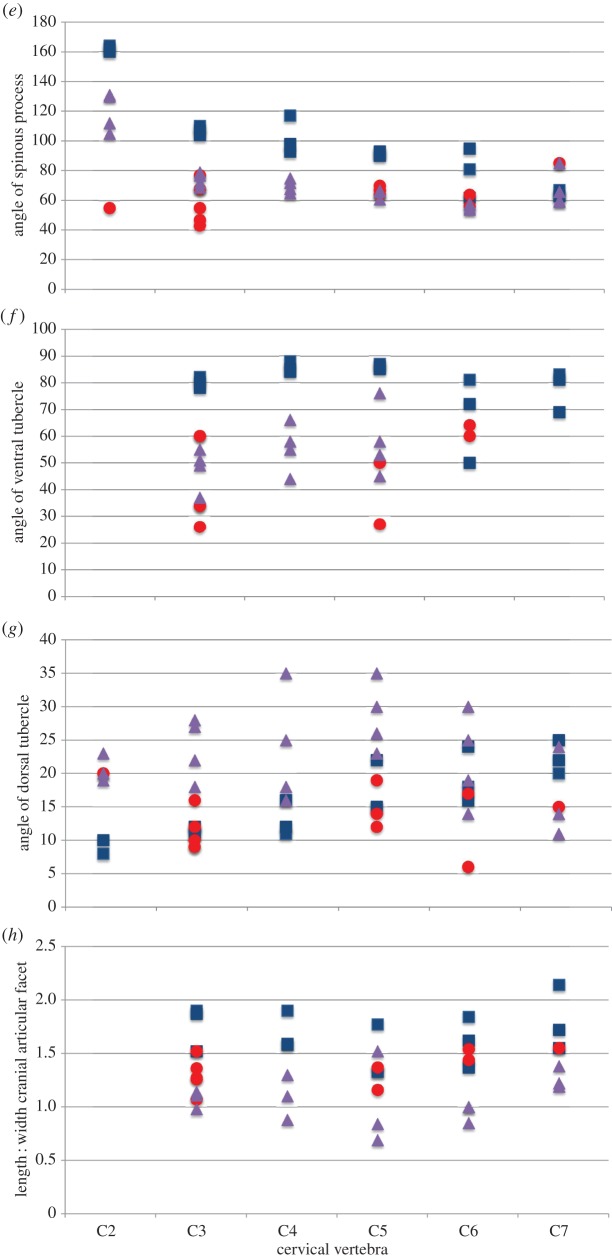
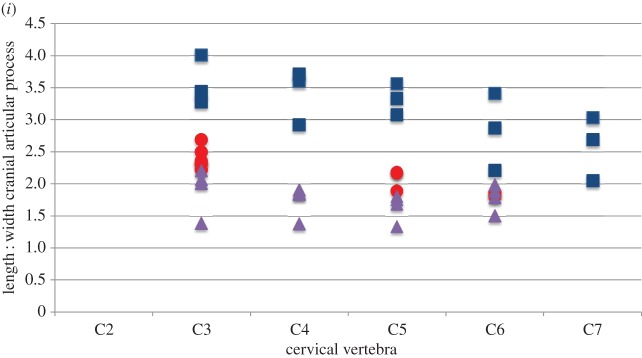
Figure 6.
Scatter plots representing dimensions and characters comparing vertebral specimens of Giraffa camelopardalis (blue squares), Samotherium major (red circles) and Okapia johnstoni (purple triangles). Each variable is represented as a ratio between two measurements, or as an angle so as to eliminate body size differences between the three taxa. (a) Centrum length : minimum width, (b) anterior width : minimum width, (c) centrum length : height of spinous process, (d) length of spinous process : length of spinous process at base, (e) angle of spinous process, (f) angle of ventral tubercle, (g) angle of dorsal tubercle, (h) length : width of cranial articular facet and (i) length : width of cranial articular process.


