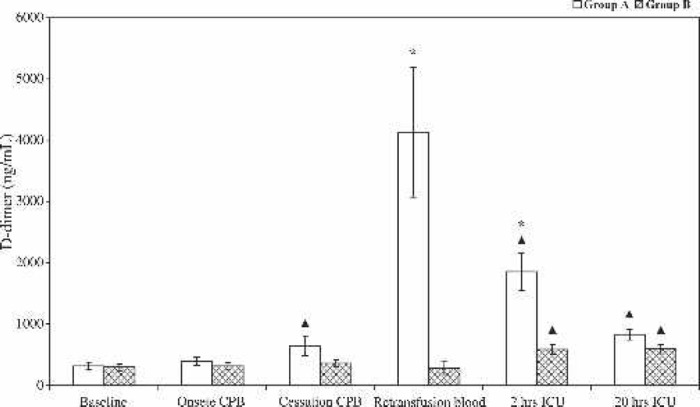
Figure 1.

Plasma concentration (mean ± SE) of cross-linked fibrin degradation products (D-dimer) during and after CPB in group A (bars) and group B (cross-hatched bars). *Statistically significant difference between the two groups (p < .001). ΔIntra-group statistically significant difference compared with baseline values (p < .01).
