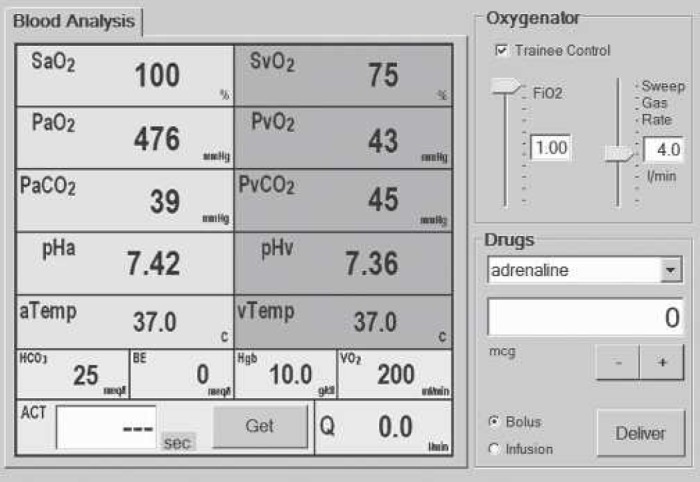
Figure 4.

The perfusionist’s user interface. The interface is made up of three main areas. To the left of the screen, arterial and mixed venous blood gases are displayed continuously. These values are updated every 500 ms. In the upper right quadrant of the display are the controls for adjusting the inspired oxygen concentration and gas flow to the artificial lung. In the lower right quadrant are the controls for administering a variety of drugs.
