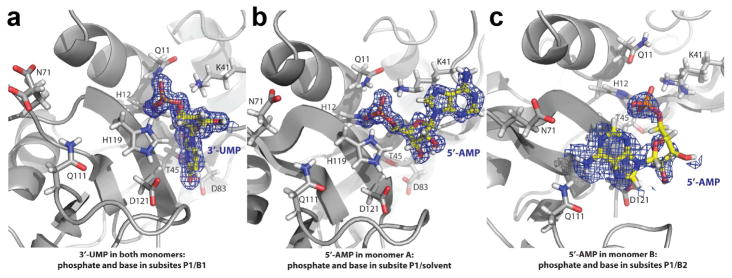
Figure 1.
Schematic representation of the mutant A109G in complex with 3′-UMP and 5′-AMP. Positioning of the ligands in the density map for (a) 3′-UMP (PDB 4WYZ) and (b,c) 5′-AMP (PDB 4WYP) on the 3D structure of the mutant A109G. The positioning of the 5′-AMP in c represents a low occupancy. Key residues (Gln11, His12, Lys41, Thr45, Asn71, Gln83, Gln111, His119 and Asp121) are show in gray stick representation. Nitrogen, oxygen and phosphate atoms are colored blue, red and orange, respectively.

