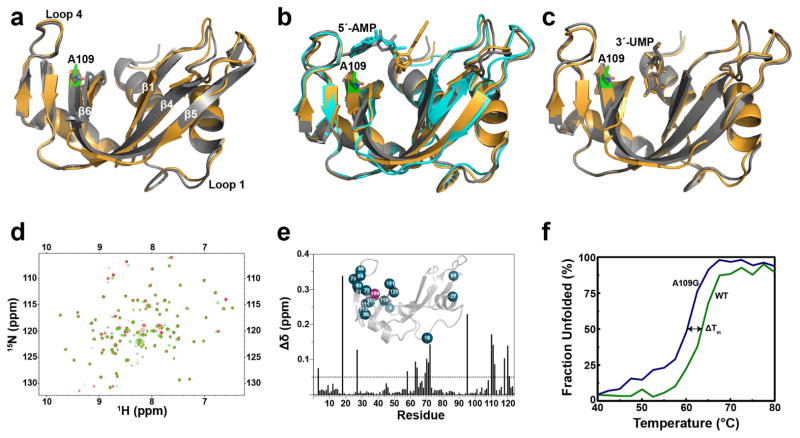
Figure 2.
Structural comparison between WT RNase A and mutant A109G. Schematic overlays of (a) apo forms of WT RNase A (grey, PDB 7RSA) and A109G (orange, PDB 4WYN), (b) 5′-AMP-bound WT RNase A (grey, PDB 1Z6S), soaked A109G (orange, PDB 4WYP), A109G monomer B corresponding to the low occupancy position of 5′-AMP (cyan, PDB 4WYP) (c) 3′-UMP-bound WT RNase A (grey, PDB 1O0N) and A109G (orange, PDB 4WYZ). The A109G site is indicated using green sticks representation. 5′-AMP and 3′-UMP are also displayed using stick representation. (d) Overlay of 1H-15N HSQC spectra for the WT RNase A (red) and A109G mutant (green). (e) Mapping of chemical shift differences (Δδ) resulting from the A109G mutation on the primary structure of RNase A. 1H and 15N composite chemical shift differences (Δδ) were calculated according to the following equation (Grzesiek et al., 1996): Δδ (ppm) = [(Δδ2HN + ΔδN/25)/2]½. The inset shows residues with Δδ > 0.05 ppm (blue spheres) highlighted on the three-dimensional structure of A109G (PDB 4WYN). (f) Temperature unfolding for WT (green) and A109G mutant (blue) RNase A determined by circular dichroism.

