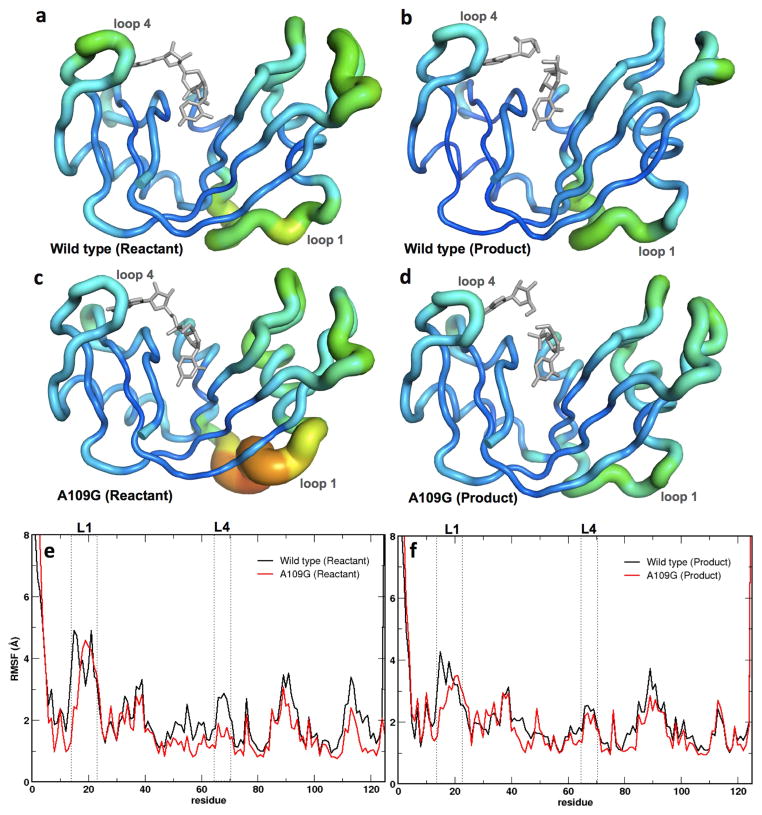
Figure 4.
Root mean square fluctuations (RMSFs) for WT RNase A and A109G mutant for a 1-μs molecular dynamics simulation. Enzyme backbone flexibility was determined from the top ten eigenmodes of the RMSFs. (a–d) RMSF values are shown using tube representations for the WT (a, b) and A109G mutant (c, d) RNase A for the reactant (left) and product (right) states. Thickness of the tube corresponds to the flexibility of the residues, with thicker tubes (red end of the spectrum) representing more flexible regions and thinner tubes (blue end of the spectrum) denoting less flexible regions in the protein. (e–f) Comparison of the RMSFs as a function of sequence for the reactant (e) and product (f) states for the WT (black) and mutant (red) proteins. Loop 1 and loop 4 (labeled L1 and L4, respectively) regions are represented using dotted lines. Panels A–D depict RMSF based on Cα while panels E-F are based on all atom calculations for each residue.

