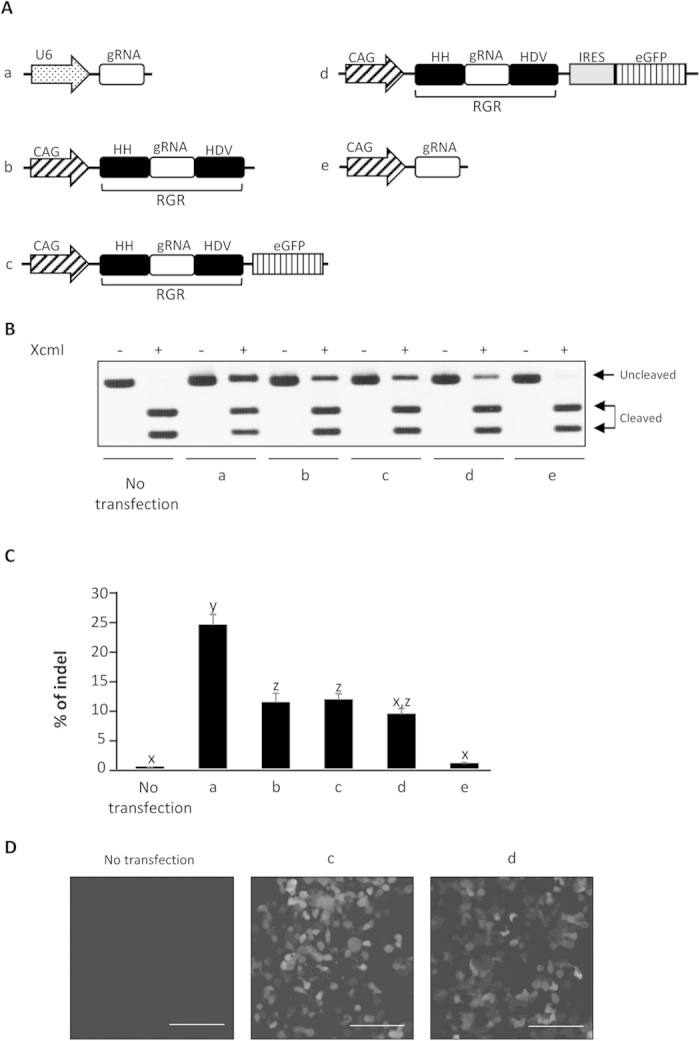
Figure 1. Expression of functional gRNAs by a RNA polymerase II promoter in a human cell line.

(A) Schematics of the gRNA expression vectors tested in (B–D). All gRNAs targeted HPRT1. (B) Restriction fragment-length polymorphism analysis. HEK 293 cells (1 × 10⁵) were co-transfected with pCAG-Cas9 (500 ng) and one of the vectors (500 ng) shown in (A), and the genomic DNAs of the cells were extracted 72 h after transfection. The DNAs were subjected to PCR, and 300 ng of the PCR products were subjected to agarose gel electrophoresis after incubation with or without XcmI. Cleaved and uncleaved fragments indicate unmodified and modified genomes, respectively. (C) The indel rates of the human HPRT1 locus in HEK 293 cells were calculated from RFLP analysis, as shown in B. The band intensity was analyzed by ImageJ software. All values represent means ± SEM of three separate experiments. Different letters indicate significant differences (P < 0.05), as determined by ANOVA followed by Tukey’s multiple comparison test (n = 3). (D) Representative images of HEK 293 cells 72 h after transfection with gRNA and eGFP expressing vectors. The scale bars represent 100 μm.
