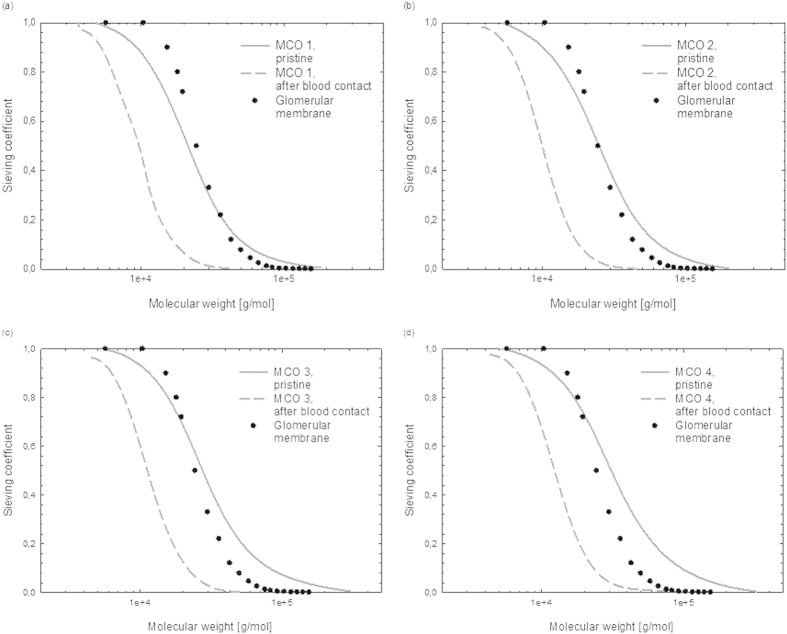
Figure 2.
Characteristic dextran sieving curves for MCO high-flux membranes before (solid line) and after blood contact (dashed line), for (a) MCO 1, (b) MCO 2, (c) MCO 3 and (d) MCO 4. The data for the glomerular membrane (as reported by Axelsson et al.15) has been added for comparison (rat specimen, ficoll filtration, measured in vivo).

