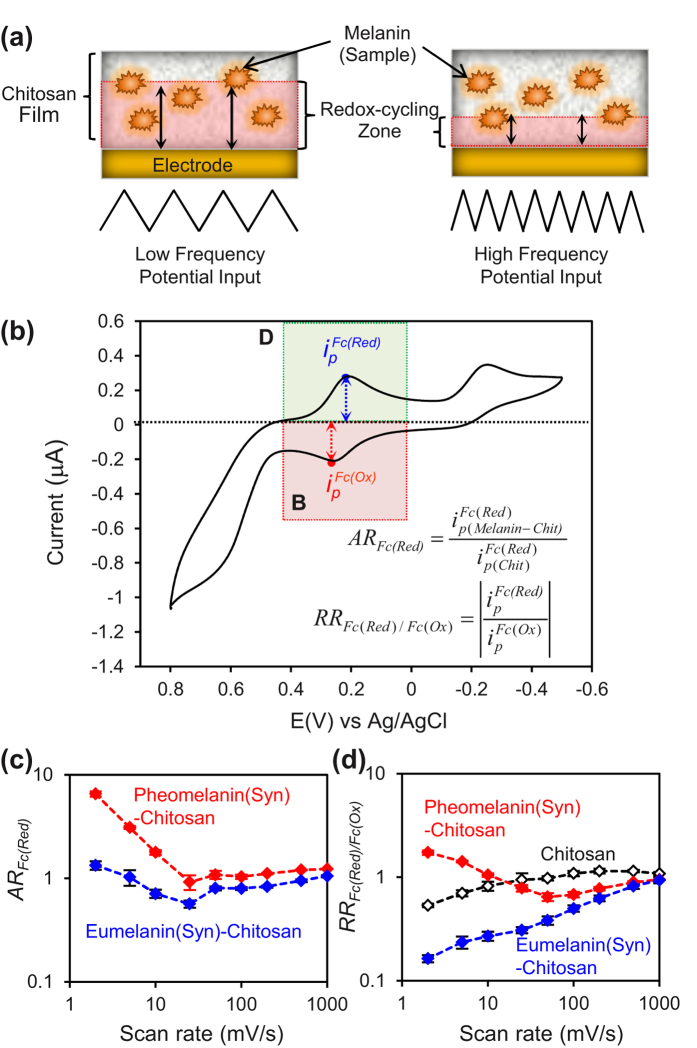
Figure 6. Dynamic probing of the synthetic pheomelanin’s oxidative potential window at varying scan rates.
(a) Schematic illustrating that scan rate affects the depth of film being probed. (b) Parameter ratios used for characterizing redox cycling in the pheomelanin’s oxidative potential window (illustrative CV scan for pheomleanin-chitosan film; 2 mV/s). (c) Amplification ratio shows the greatest difference from control chitosan film is observed at the low scan rates (as expected). (d) Rectification ratios shows that Fc serves as an oxidant with eumelanin (RRFc < 1) but a reductant for pheomelanin (RRFc > 1).

