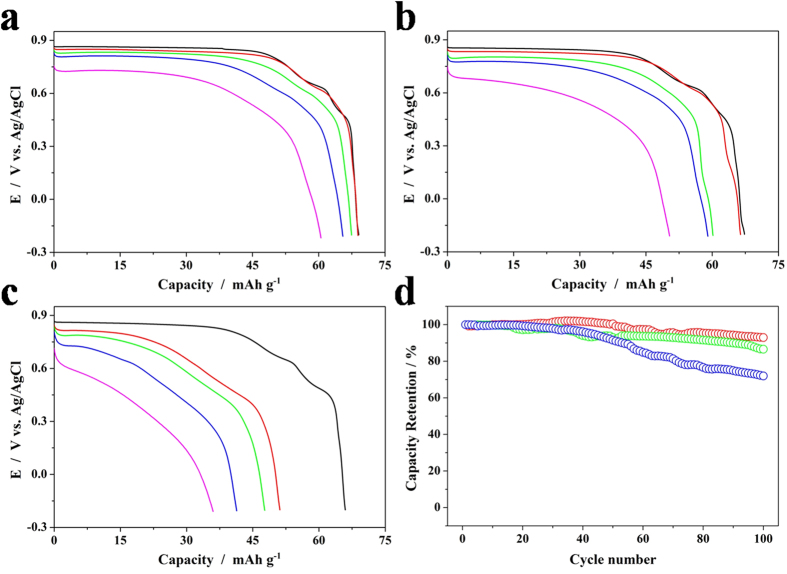
Figure 6. Electrochemical properties of shape-controlled RZnHCFs in 3M ZnSO4 electrolytes.
The discharge curves at the rate of 60 mA g−1 (black), 300 mA g−1 (red), 600mA g−1 (green), 1200 mA g−1 (blue) and 3000 mA g−1 (magenta) of (a) C-RZnHCF, (b) T-RZnHCF and (c) O-RZnHCF based on the initial discharge capacity. (d) Cycle life test of shape-controlled RZnHCFs at 300 mA g−1. Red, green and blue circles represent C-RZnHCF, T-RZnHCF and O-RZnHCF, respectively.

