Figure 1.
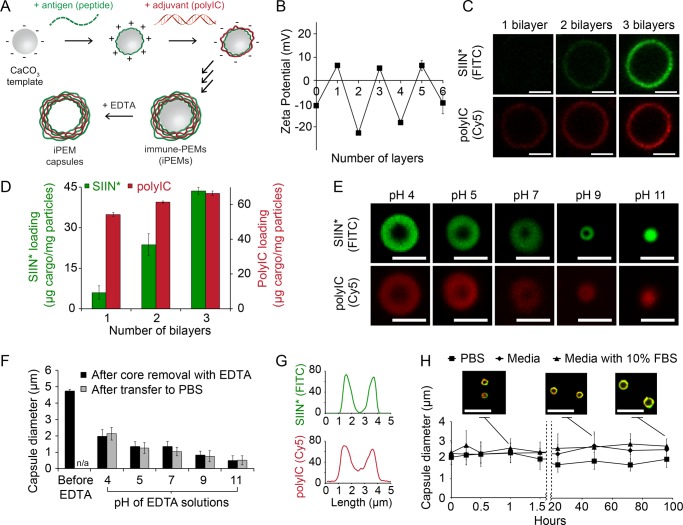
iPEM capsules are stable and exhibit sizes that are a function of pH. (A) Schematic representation of iPEM capsule synthesis using antigens and adjuvants. (B) Zeta potential measurements indicating charge inversion as each antigen or adjuvant layer is adsorbed during iPEM synthesis. (C) Confocal microscopy images and (D) cargo loading during assembly of (SIIN*/polyIC)3 on CaCO3 templates. (E) Confocal microscopy images and (F) diameter of iPEM capsules formed following removal of the core with EDTA at the indicated pH values (black bars), and after subsequent transfer to PBS (gray bars). (G) Fluorescent intensity distributions of SIIN* (FITC) and polyIC (Cy5) across a cross-section of a representative capsule formed by EDTA treatment at pH 4. (H) Stability of iPEM capsules during incubation at 37 °C in PBS, media, or media with 10% FBS. The inlay shows images of iPEM capsules during incubation in media with 10% FBS for 1, 48, and 96 h. Values for all panels represent the mean ± standard deviation. Scale bars: (C, E) 2.5 μm; (H) 10 μm.

