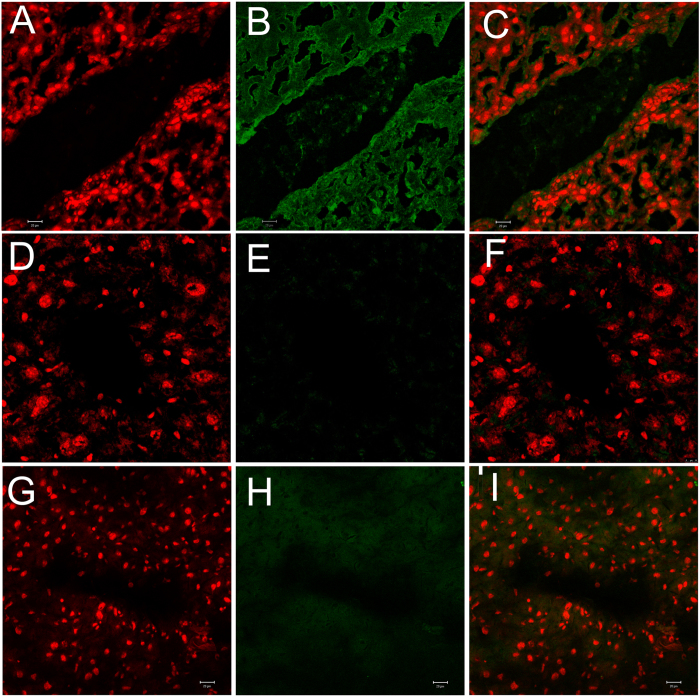
Figure 5. Confocal microscopy analysis of Mac3 expression in Angiotensin-II and β-carotene-treated Apoe−/− mice.
(A–C) Mac3 over expressed marginally in the liver tissues of Ang II- treated Apoe−/− mice; (D–F) Mac3 show no expression in β-carotene-treated Apoe−/− mice; (G–I) No expression of Mac3 is noticed in control liver.

