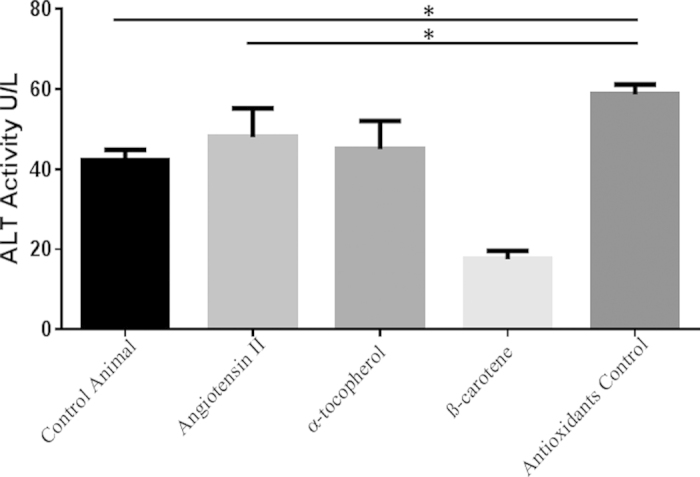
Figure 8. ALT activity in different treatment groups of Apoe−/− mice.

Examined ALT activity in the different treatment groups were compared with control Apoe−/− mice. ALT activity levels of Angiotensin-II-treated group were remarkably elevated as compared to control (p~0.007). AST levels of antioxidants control group (Angiotensin-II infused and no antioxidant supplements) were significantly further elevated as compared to the Angiotensin-II and control groups. Footnotes: *Indicates significant difference between the individual treatment groups marked by arrow line.
