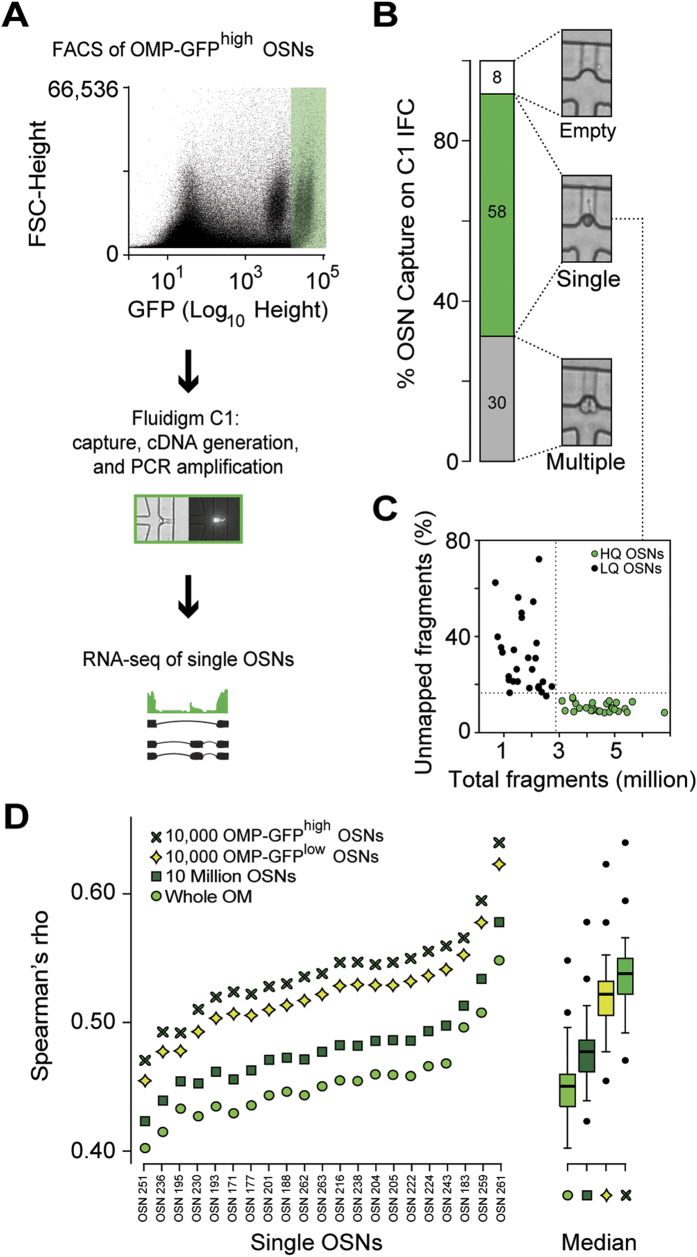
Figure 3. RNA-seq in single mature OSNs.
(A) Schematic of the single-cell RNA-seq experimental strategy. After dissection of WOM of a heterozygous OMP-GFP mouse, 5,000 mature OMP-GFPhigh OSNs were collected by FACS into a C1 IFC (10–17 μm, Fluidigm). Using the Fluidigm C1 platform, single cells were sorted, imaged, RNA extracted, cDNA generated, and libraries amplified for deep-sequencing. A representative bright field and fluorescence image for a captured single OSN is shown in the middle panel. (B) Capture rate for single cells: 30 wells captured more than one cell and/or debris, 58 captured single cells, and 8 were empty. Representative bright field images are shown for each of these categories. (C) The 58 captured single OSNs were subjected to stringent, hierarchical quality control criteria, which defined low-quality (LQ, black dots) and high-quality cells (HQ, green dots, see also Supplementary Fig. S3; and Supplementary Methods). (D) Spearman correlation coefficients of the 21 single cells used in our downstream analysis with the WOM and OSN populations (10 million, OMP-GFPlow and OMP-GFPhigh OSNs). As expected, the single cells correlate best with the OMP-GFPhigh OSNs, followed by the OMP-GFPlow OSNs, the 10 million OSNs and finally WOM. To the right of the graph, boxplots show the cumulative data for each comparison. The thick black horizontal bar corresponds to the median and data points that are outside 1.5 times the interquartile range (the box) are indicated as outliers (black dots).

