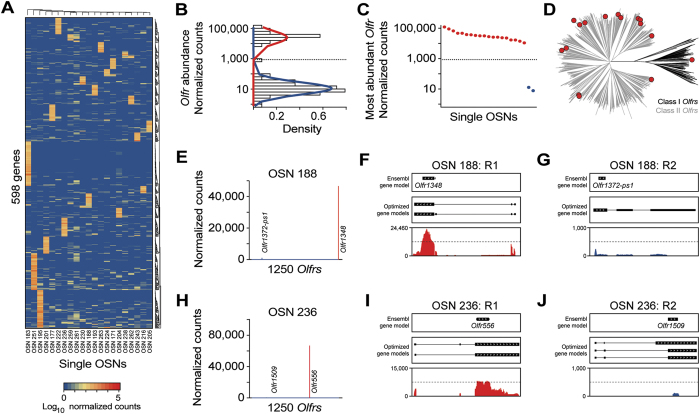
Figure 5. OR gene expression patterns single OSNs.
(A) Heatmap of the expression levels of the most variable genes in single OSNs. All 598 highly expressed genes (≥1000 normalized counts in at least 1 sample) with a coefficient of variation ≥4 are represented. The identity of these genes are presented in Supplementary Data S3. (B) Normal-like distributions were fitted for all lowly expressed (blue line) and highly expressed (red line) OR genes. Only genes at or above the intersection of both curves (855 normalized counts) were considered as abundantly expressed. (C) Expression level of the most abundant OR in each of the 21 single OSNs. The most abundant ORs in OSN 259 and OSN 261 are expressed at extremely low levels. (D) Phylogenetic tree of all mouse OR genes (Class I and II in black and grey, respectively). The most abundant ORs in all the single OSNs analyzed are depicted as red circles. (E) Expression levels of all ORs in OSN 188. The two most abundant ORs in that cell are indicated. (F,G) Coverage plots of the RNA-seq data for OSN 188 mapping to the first (Olfr1348, (F)) and second (Olfr1372-ps1, (G)) most abundant ORs. Boxes correspond to exons and arrowheads indicate the strand of the gene. The existing Ensembl annotations are shown in the top box. Optimized OR gene models11 used in our analysis are shown in the middle box. The sequencing data mapping to the OR gene models is below. (H) Expression levels of all ORs in OSN 236. The two most abundant ORs in that cell are indicated. (I,J) Coverage plots of the RNA-seq data for OSN 236 mapping to the first (Olfr556, (I)) and second (Olfr1509 (J)) most abundant ORs. Boxes correspond to exons and arrowheads indicate the strand of the gene. The existing Ensembl annotations are shown in the top box. Optimized OR gene models11 used in our analysis are shown in the middle box. The sequencing data mapping to the OR gene models is below.

