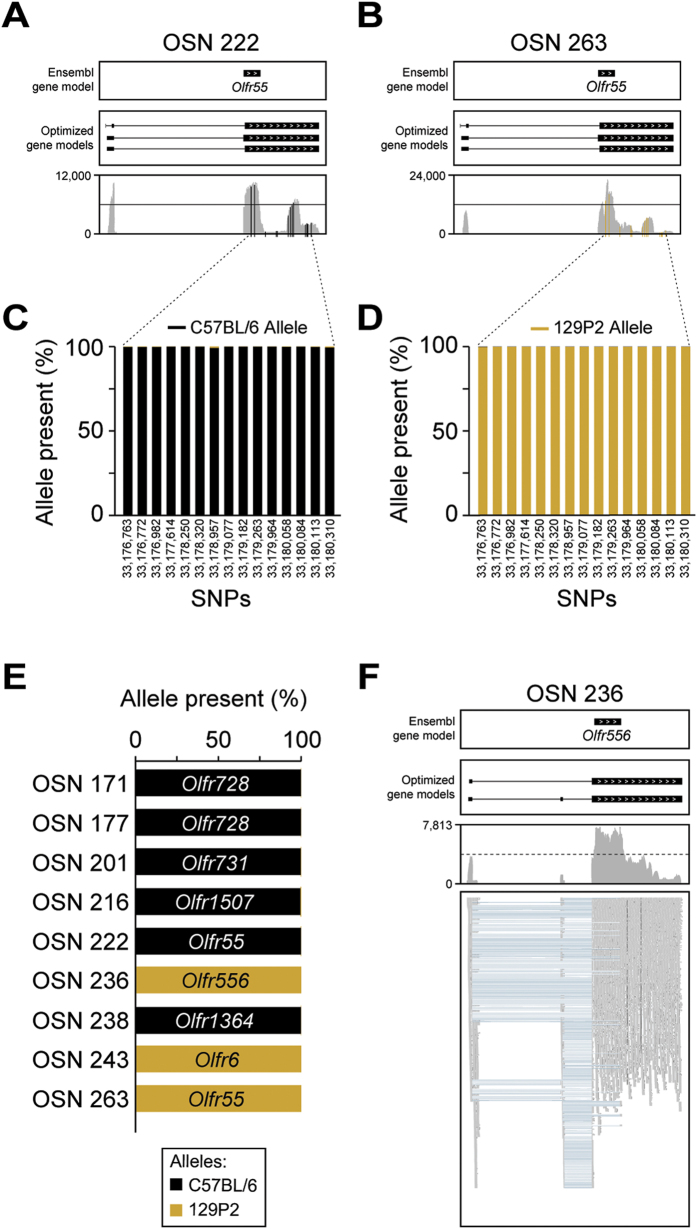
Figure 6. Monoallelic expression of OR genes in single OSNs.
(A,B) Coverage plots of the sequencing data mapping to the same OR (Olfr55) in two cells, OSN 222 (A) and OSN 263 (B). Boxes correspond to exons and arrowheads indicate the strand of the gene. The existing Ensembl annotations are shown in the top box. Optimized OR gene models11 used in our analysis are shown in the middle box. The sequencing data mapping to the OR gene models is below. Reported single nucleotide polymorphisms (SNPs) used to map the C57BL/6 and 129P2 alleles are shown in black and golden vertical lines, respectively. (C,D) The percentage (%) of sequencing data showing the C57BL/6 (black) or the 129P2 (gold) allele at each SNP on Olfr55 in OSN 222 (C) and OSN 263 (D). Genomic coordinates on chromosome 17 for each SNP are indicated in the x-axis. (E) The percentage (%) of sequencing data showing the C57BL/6 (black) or the 129P2 (gold) allele for all ORs with at least one reported informative SNP. In all cases, only one allele is expressed per cell. (F) Example of differential splicing of an OR gene. The sequencing reads in the bottom panel are represented by grey boxes; blue lines join portions of reads that map across exon junctions. Two isoforms are present, with the differential inclusion of the second exon. Thus individual OSNs express multiple isoforms of the chosen OR gene.

