
Figure 2. Effect of h/r, ψ, t and ν on the macroscopic Poisson’s ratio of the dimpled elastic sheet,  .
.
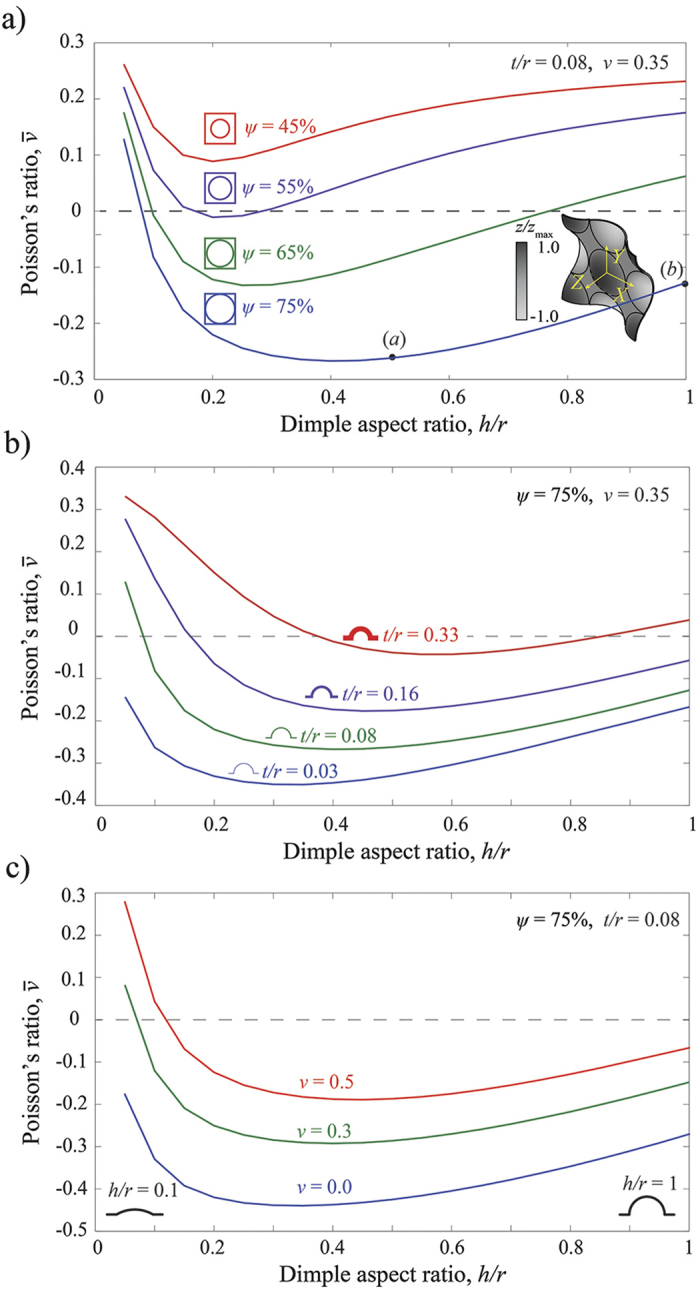
Evolution of  as a function of h/r is shown in (a) for four different values of ψ (assuming t/r = 0.08 and ν = 0.35), in (b) for four different values of t/r (assuming ψ = 75% and ν = 0.35), and in (c) for four different values of ν (assuming ψ = 75% and t/r = 0.08).