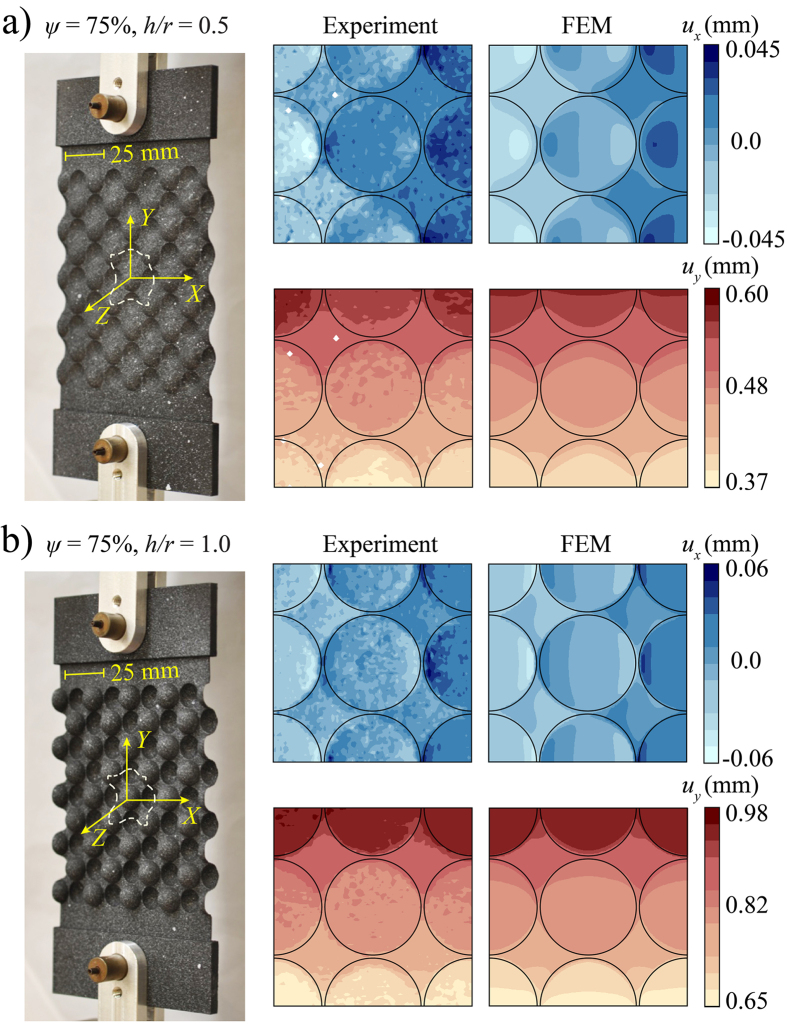
Figure 3. Contour maps for the horizontal (ux) and vertical (uy) components of the displacement fields.
Experimental (left) and numerical (right) results are quantitatively compared for two structures characterized by (a) ψ = 75%, h/r = 0.5 and (b) ψ = 75%, h/r = 1.0. Snapshots of the deformed samples are shown on the left, with the central unit cell highlighted by white dashed lines.

