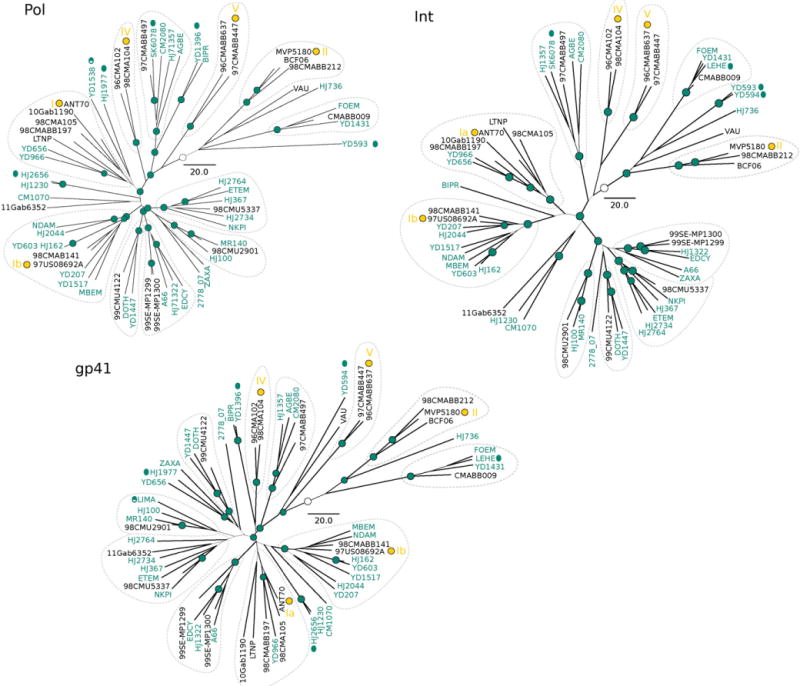
Fig. 1.

Maximum clade credibility trees for the partitioned analysis. New sequences are colored in dark green. The width of the branches represents Bayesian posterior probabilities (values above 0.9 are symbolized with dark green nodes circles). Clustering of sequences are indicated with dotted lines for the sake of comparisons. Yamaguchi et al. (2002) clusters were indicated with yellow roman numerals. The white circles represent the inferred root. Scale bar for years.
