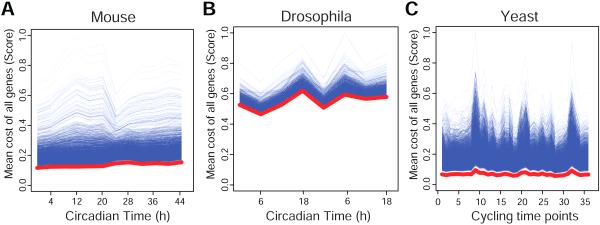
Figure 4. Cycling gene expression yields an optimized overall cost.
Simulation experiments were performed by randomly switching the cycling genes with other genes and measuring the mean cost of all the genes in (A) mouse, (B), Drosophila or (C) yeast. The red lines indicate the experimentally observed results, whereas the blue lines are the simulations.

