Fig. 2.

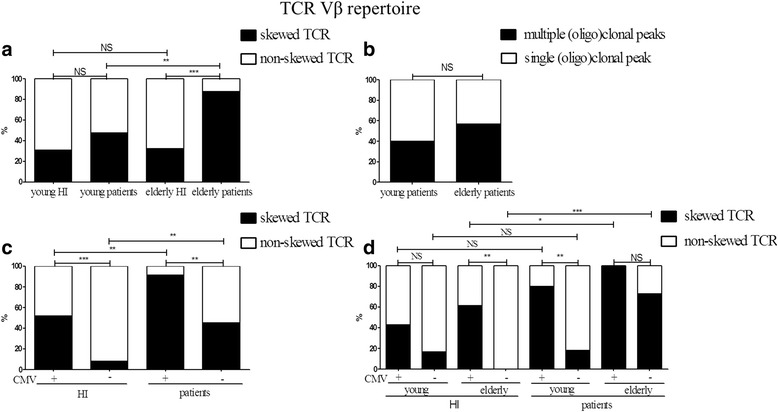
Skewed and non-skewed TCR Vβ repertoire distribution in healthy individuals (HI) and end stage renal disease (ESRD) patients dissecting the population into subgroups according to age and CMV-IgG serostatus. a Frequency of a skewed TCR Vβ repertoire in young (n = 21) and elderly (n = 24) ESRD patients compared to age- matched HI (young, n = 26 and elderly, n = 25). b Frequency of multiple (oligo)clonal peaks within a skewed TCR Vβ repertoire of young (n = 10) ESRD patients compared to elderly ESRD patients (n = 21). c Frequency of a skewed TCR Vβ repertoire in CMV-IgG seropositive (n = 23) and seronegative (n = 22) ESRD patients, compared to CMV-IgG seropositive (n = 27) and seronegative (n = 24) healthy individuals. d Frequency of a skewed TCR Vβ repertoire in young ESRD patients with CMV- IgG seropositive status (n = 10) or CMV-IgG seronegative status (n = 11) and elderly ESRD patients with CMV-IgG seropositive status (n = 13) or CMV-IgG seronegative status (n = 11), compared to age-matched CMV-IgG seropositive (young n = 14, elderly n = 13) and CMV IgG seronegative (young n = 12, elderly n = 12) HI. The closed squares represent skewed or multiple oligo(clonal) peaks within skewed TCR Vβ repertoires whereas the open squares represent non-skewed or single (oligo)clonal peaks within skewed TCR Vβ repertoires, respectively. P value: * <0.05; ** < 0.01; *** < 0.001; NS: not significant
