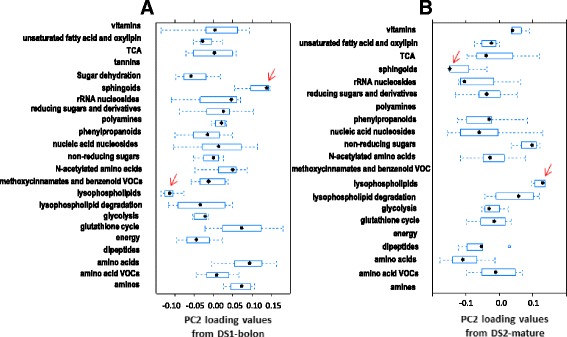
Fig. 7.

Boxplots of PC2 loading values arranged by metabolic class. a DS1-bolon, b DS2-mature. The classification of metabolites follows that developed for PC1 (refer to methods). For both datasets, metabolite classes sphingoids and lysophospholipids (pointed at with a red arrow) appeared to underlie the effect captured by PC2. Classes with less than three metabolites were not considered; these consisted of tannins and dipeptides for DS1-bolon and polyamines, methoxycinnamates and benzenoid VOCs, energy and amines for DS2-bolon. The star in each box indicates the median loading value per metabolic class
