. 2015 Aug;96(Pt 8):2104–2113. doi: 10.1099/vir.0.000178

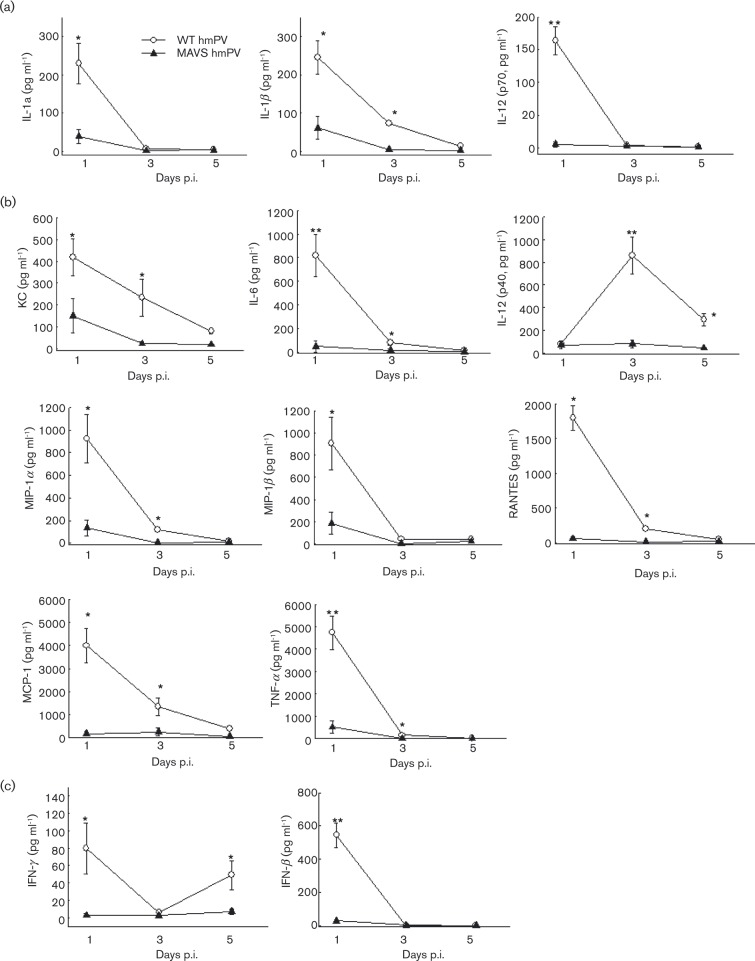
Fig. 1. Effect of MAVS on pulmonary cytokine and chemokine production in hMPV-infected lung. BAL samples collected from mock- and hMPV-infected mice, WT and MAVS− / − , at indicated time points p.i., were assessed for IFN-β by ELISA. Other cytokine and chemokine production was measured by a multi-Plex Cytokine detection system. Data are mean ±  SEM from n = 10–12 mice in each group from three independent experiments. *P < 0.05 and **P < 0.01 for comparison with hMPV-infected samples from WT mice. Induced cytokines and chemokines in WT mice with levels of ≤ 300 pg ml− 1 or ≥ 400 pg ml− 1 induction at day 1 p.i. were grouped in (a) and (b), respectively. IFNs are shown in (c).

Fig. 1.