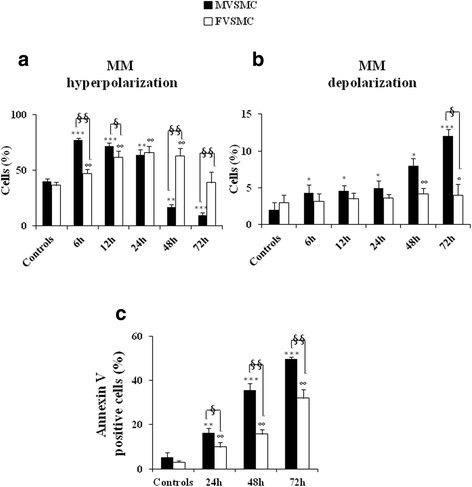
Fig. 3.

Role of mitochondria in VSMC fate after UVB exposure. Flow cytometry analyses of a mitochondrial membrane potential (MMP) hyperpolarization and b MMP depolarization at different time points starting from the end of UVB exposure. c Flow cytometry analyses of apoptosis after double staining with annexin V/propidium iodide at different time points after UVB exposure. The results obtained are the mean of three independent experiments ± S.D. Student’s t test indicates a (***) p < 0.001 for MVSMC (controls vs 6, 12, and 72 h after UVB); (**) p < 0.01 for MVSMC (controls vs 24- and 48-h UVB); (°°) p < 0.01 for FVSMC (controls vs 6-, 12-, 24-, and 48-h UVB); (§§) p < 0.01 MVSMC vs FVSMC 6-, 48-, and 72-h UVB; and (§) p < 0.05 MVSMC vs FVSMC after 12 h UVB. b (***) p < 0.001 for MVSMC (controls vs 72-h UVB); (*) p < 0.05 for MVSMC (controls vs 6-, 12-, 24-, and 48-h UVB); (°°) p < 0.01 for FVSMC (controls vs 48-h UVB); (°) p < 0.05 for FVSMC (controls vs 72-h UVB); (§) p < 0.05 MVSMC vs FVSMC 72-h UVB. c (***) p < 0.001 for MVSMC (controls vs 48- and 72-h UVB); (**) p < 0.01 for MVSMC (controls vs 24-h UVB); (°°) p < 0.01 for FVSMC (controls vs 24-, 48-, and 72-h UVB); (§§) p < 0.01 MVSMC vs FVSMC 48- and 72-h UVB; and (§) p < 0.05 MVSMC vs FVSMC after 24-h UVB
