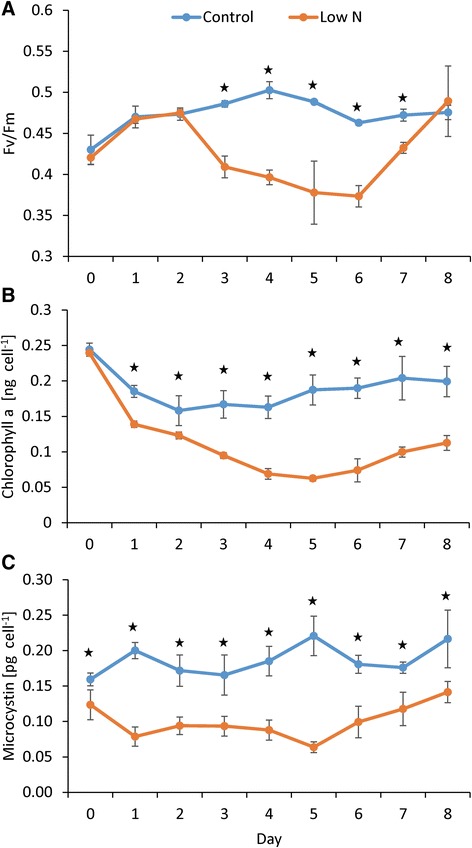
Fig. 1.

Photosynthetic efficiency, chlorophyll, and microcystin trends during the experiment. Photosynthetic efficiency (a), total chlorophyll a (b) and microcystin (MC-LR equivalents) concentrations per cell (c) during the experiment. Nitrogen refeed occurred on day 5. Error bars represent the standard deviation between biological replicates (n = 3). Stars indicate significant differences between treatments (p <0.001, two-way ANOVAR)
