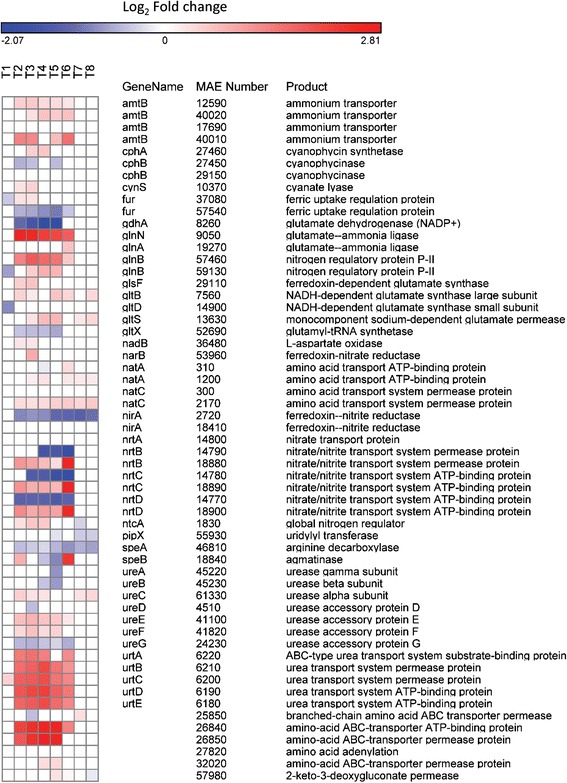
Fig. 2.

Nitrogen transport and metabolism expression patterns. Heat map of gene expression of genes involved in nitrogen metabolism and transport. Blue colors correspond to a decrease in transcript abundance while red colors correspond to an increase in transcript abundance. White denotes no difference from the control condition
