Fig. 3.

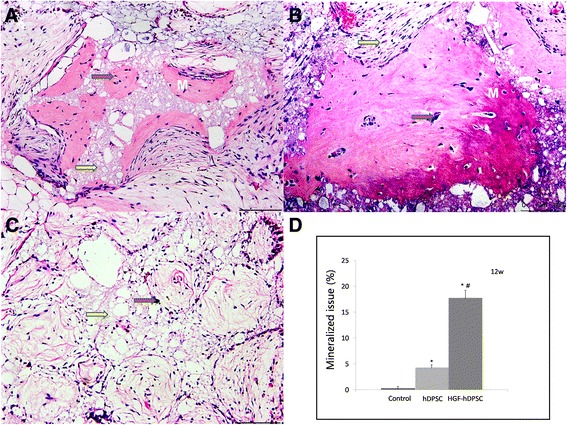
Ectopic mineralized tissue formation analysis. a–c Mineralized tissue formation was observed in both the hDPSC a and HGF-hDPSC b groups compared with control c, but more was observed in the HGF-hDPSC group b. d Compared with the control group (HA-TCP alone), more mineral tissue was formed in both the hDPSC and HGF-hDPSC groups (*P <0.01), but more was formed in the HGF-hDPSC group than in the hDPSC group (# P <0.01). Red arrow, HA-TCP; yellow arrow, collagen fiber. Scale bar = l00 μm. 12w 12 weeks, hDPSC human dental pulp stem cell, HGF hepatocyte growth factor, M mineralized tissue
