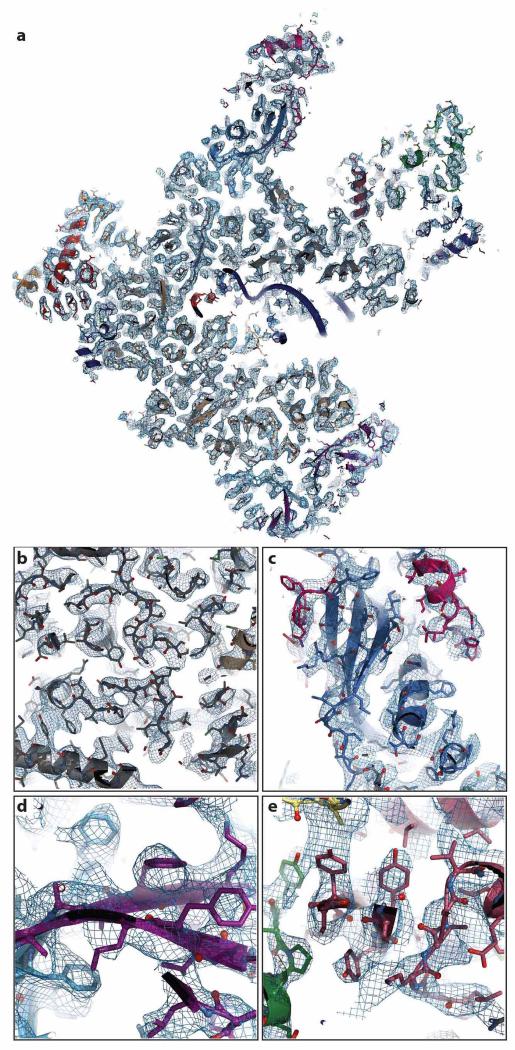
Extended Data Figure 2. Representative sections of the cryo-EM density for elongating Pol III.
a, Cross-section of elongating Pol III in ribbon and stick representation, embedded in the experimental density at 3.9 Å, displayed in tungsten. b, Section displaying the core subunits C160 (grey) and C128 (wheat) shown in stick and ribbon representation. The experimental density of the core (tungsten) is well defined and has been filtered at 3.5 Å resolution for display. c, Section of stalk subunits C25 (blue) and C17 (pink). The estimated local resolution in this part is lower compared to the core (Extended Data Table 2). In panel c, d and e, the cryo-EM density is shown at 3.9 Å resolution. d, Section showing subunits C53 (purple) and C37 (lanthanum). e, Close-up view of C82-WH1 (brown), C82–WH2 (green) and C31 (yellow) interface.

