
Fig. 4.
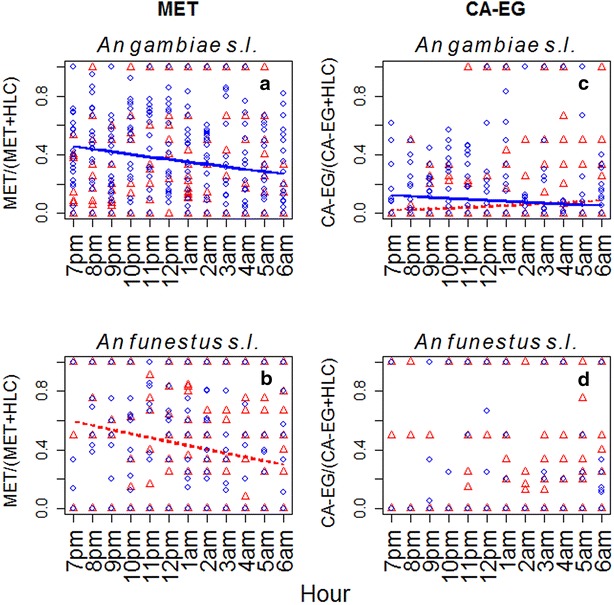
The sampling efficiency of the two novel trap types (CA-EG and MET) relative to the HLC gold standard across the hours of a sampling night. Points indicate the proportion of the total catch (new trap + HLC) that was captured by the new trap over each hour of a sampling night (19.00–07.00). Triangle symbols are for collections made indoors, and round dots for outdoors. Dotted-red and solid-blue lines represent predicted relationship between the relative sampling efficiency across the hours of a sampling night, indoors and outdoors, respectively, (lines only shown when there was a statistically significant change through time)