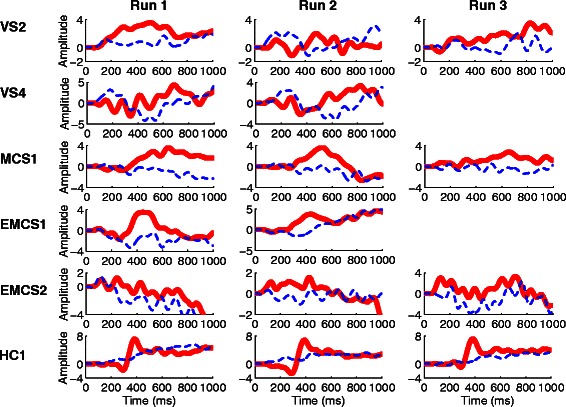
Fig. 3.

Grand-average P300 ERP waveforms from the “Pz” electrode in Run 1 (left panels), Run 2 (middle panels) and Run 3 (right panels) for five patients (VS2, VS4, MCS1, EMCS1, and EMCS2) and a healthy control. The red curves corresponding to target button frames contained P300 responses, whereas the blue curves corresponding to non-target button frames did not
