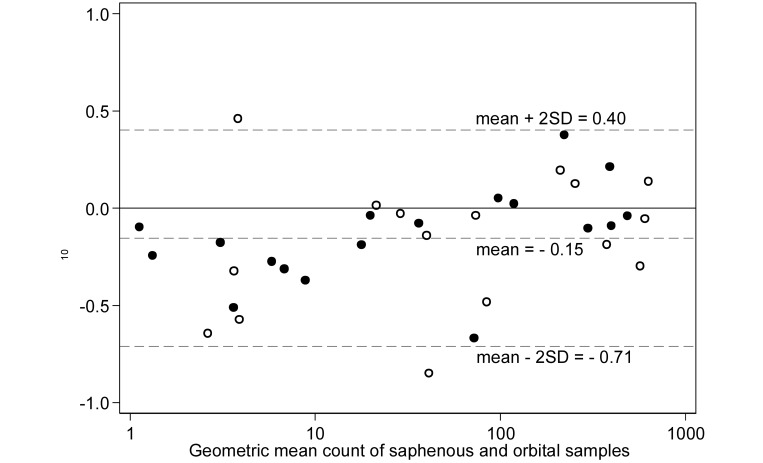
Figure 3.
Bland–Altman plot of the difference in log10 microfilaria counts compared with the geometric mean count for paired blood samples collected from the saphenous vein and orbital sinus of 18 gerbils on each of 2 occasions. Markers differentiate between the first (hollow circles) and second (solid circles) sampling occasions. Dashed lines represent the mean difference between the methods and the upper and lower 95% limits of agreement (mean ± 2 SD).

