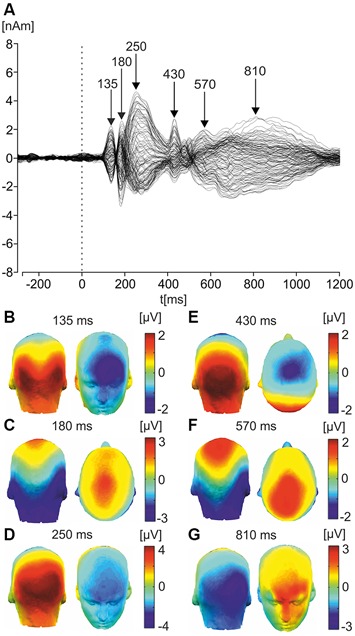
Figure 2.

Butterfly plot of grand average ERP response to faces and corresponding scalp topographies. (A) Butterfly plot of grand average ERPs in response to faces. Peak latencies of distinct ERP components (135, 180, 250, 430, 570, and 810 ms) are highlighted with arrows. (B) Latency component 135 ms (P1). The topographic maps of grand average ERPs overlaid on the volume rendering of the human head are shown. (C) Latency component 180 ms (N170). (D) Latency component 250 ms (P300). (E) Latency component 430 ms (N400). (F) Latency component 570 ms (late component/LPP). (G) Latency component 810 ms (ultra-late component/LPP).
