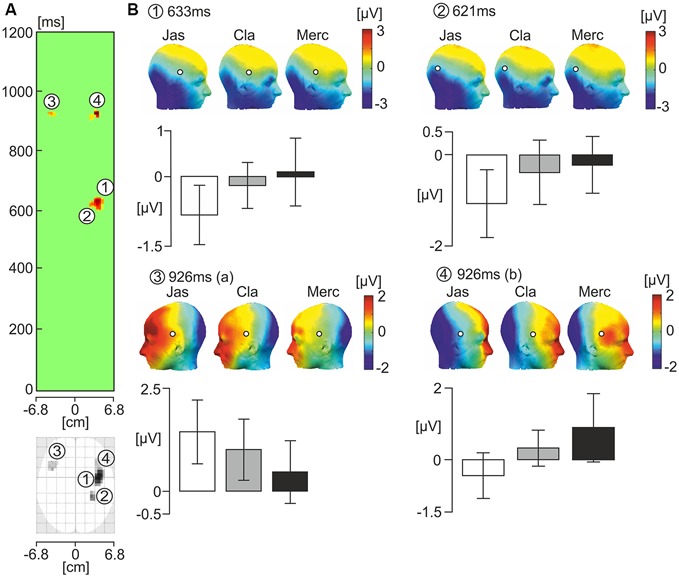
Figure 3.

One-way ANOVA showing the effects of the three odor conditions on ERP response to faces. (A) The green panel shows statistically significant latency periods (uncorrected p < 0.005) in the scalp-time plot where F values represent the strength of variance between odor conditions over the horizontal axis of the scalp in every time sample from 0 and 1200 ms relative to the onset of the face photograph. The scalp values over the horizontal axis of the scalp are averages of F values occurring at each vertical point for a given horizontal point in the standardized scalp map (from −6.8 to +6.8 cm). Two latency intervals showed the presence of statistically significant spatio-temporal clusters. In the interval 600−640 ms, two clusters numbered 1 and 2 showed a significant effect of odor condition. In the latency period 910−930 ms, clusters numbered 3 and 4 showed a significant effect of odor condition. Below the green panel is the standard scalp map of statistically significant clusters using ERPs. (B) Corresponding topographic maps of the numbered significant cluster latencies under each odor condition (Jas-jasmine, pleasant odor; Cla-clean air, control; Merc-methylmercaptan, unpleasant odor). White circles with a black outline pinpoint the location of the significant electrode clusters. Bar graphs below illustrate the mean EEG amplitude for each cluster/latency under each odor condition (μV). White bars represent the pleasant odor condition, gray bars represent the neutral control condition, and black bars represent the unpleasant odor condition.
