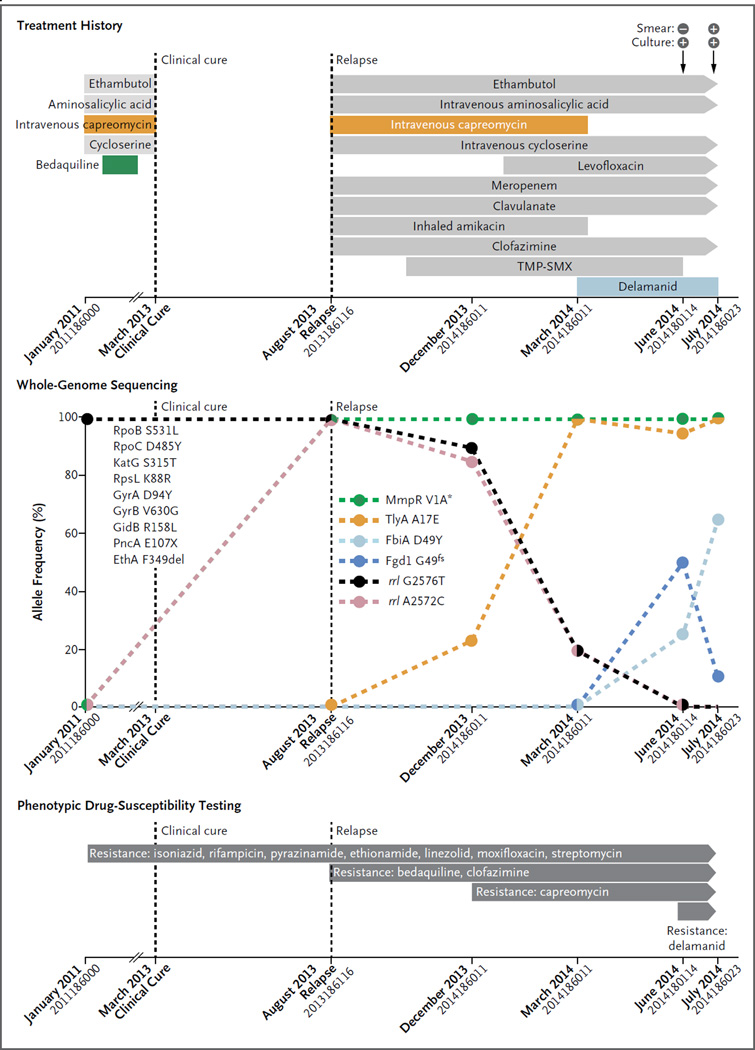
Figure 1. Clinical Features, Treatment History, Amplification of Drug Resistance, and Phenotypic Drug-Susceptibility Testing in the Patient.
Mutations that confer drug resistance are shown. Resistance to bedaquiline, intravenous capreomycin, and delamanid developed. Percentages on the y axis are based on the number of genome-sequencing reads supporting the corresponding drug resistance–conferring mutation (details are provided in Table S4 in the Supplementary Appendix). Large colored circles indicate measurements, and dashed lines linking these circles indicate the changes in mutation frequency. The loss of the start codon is indicated with an asterisk, and fs indicates frame shift. The mutations listed on the left side of the graph were detected in the first and all subsequent isolates obtained from the patient. All these mutations were seen in 100% of sequencing reads in each isolate. X indicates the stop codon, and del indicates deletion. On the x axis, isolate numbers are listed under the month when the isolate was obtained. TMP-SMX denotes trimethoprim–sulfamethoxazole.

