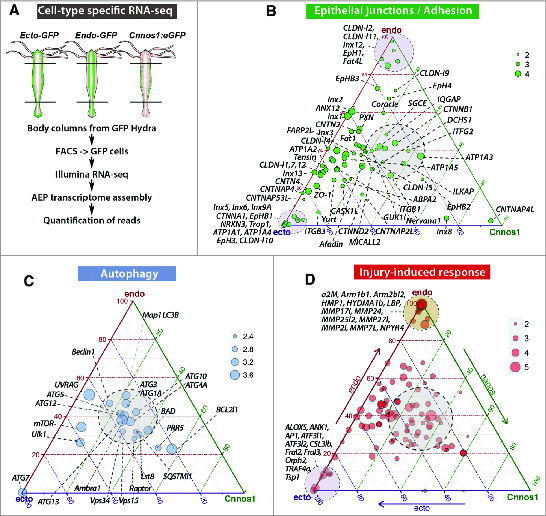
Figure 2.

Molecular patterns of the ectodermal and endodermal epithelial cells as deduced from RNA-seq transcriptomic analyses. (A). Scheme depicting the procedure to produce RNAs from each stem cell population by dissecting the body columns of 3 transgenic AEP strains that constitutively express GFP either in the ectodermal epithelial cells (ECTO actin::eGFP12), or in the endodermal epithelial cells (ENDO actin::eGFP11), or in the interstitial stem cells.39 The quantitative RNA-seq analysis was performed on FACS-sorted cells.13,14 (B–D). Ternary plots showing the cellular distribution of gene transcripts encoding epithelial junction - cell adhesion proteins (B), injury-induced immune proteins (C) and autophagy proteins (D). Each dot represents the expression of a unique gene as the computation of the median values of 4 biological replicates in each cell type. Maximal endodermal expression is at the top (endo), ectodermal at the bottom left (ecto) and interstitial at the bottom right (cnnos1). The position of each dot results from the relative transcript abundance in these 3 cell types, with genes similarly expressed in the 3 cell types located in the gray central zone. The dot size is proportional to the number of log10(reads) reads as indicated on the scale.
