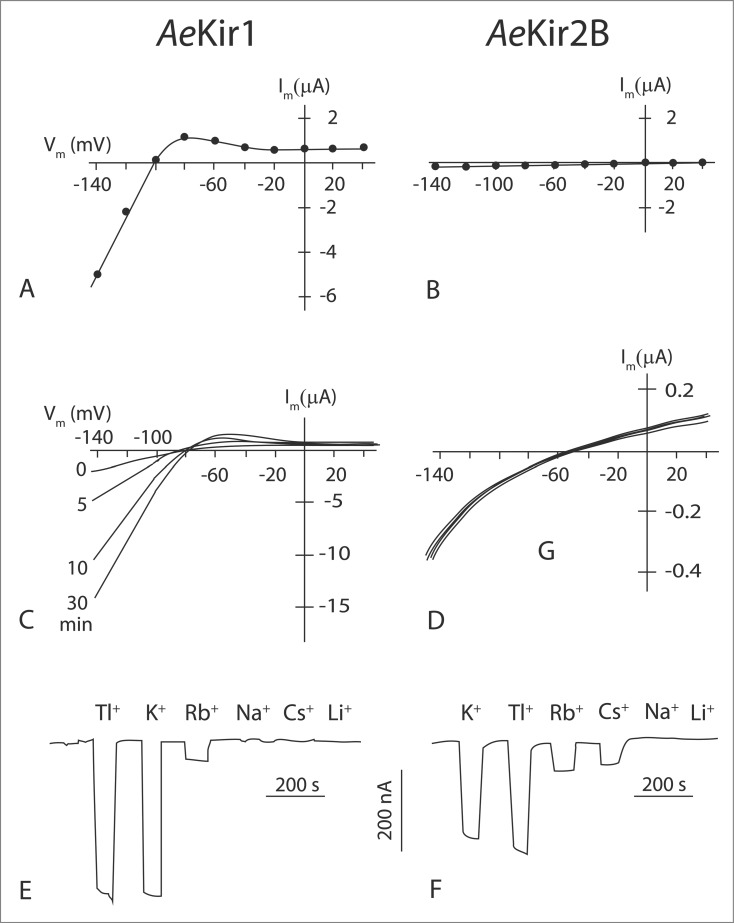
Figure 3.
Functional differences between AeKir1 and AeKir2B expressed in Xenopus oocytes. A,B, current-voltage (I-V) plots of oocytes bathed in Ringer solution containing 2 mM K+ and 96 mM Na+; C,D, I-V plots of oocytes bathed in Ringer solution containing 5 mM K+ and 0.5 mM Na+ at 0 min and 5 mM K+ and 93 mM Na+ at 5, 10 and 30 min; E, cation selectivity of oocytes clamped continuously at −92 mV and bathed in Ringer solution containing 0.5 mM K+ and 0.5 mM Na+ and superfused with 5 mM test cation; F, cation selectivity of oocytes clamped continuously at −93 mV and bathed in Ringer solution containing 0.5 mM K+ and 0.5 mM Na+ and superfused with 10 mM test cation. Note the high currents in AeKir1 compared to AeKir2B. Adapted from Piermarini et al.22

