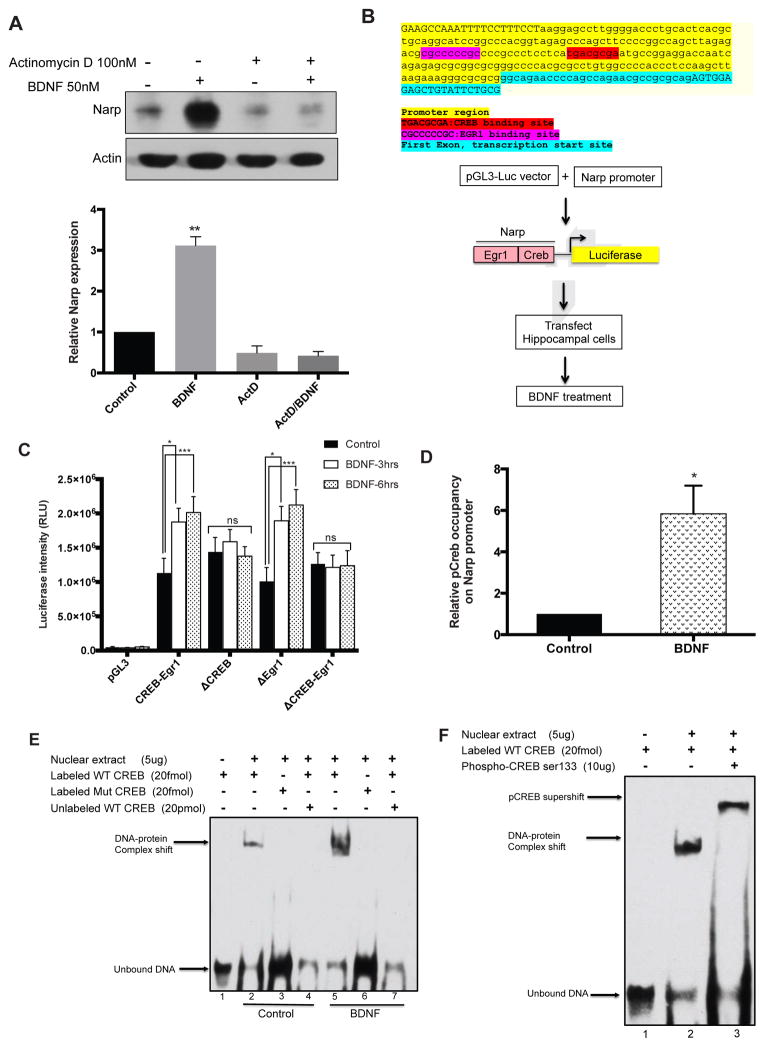
Figure 4. Regulation of Narp by BDNF involves activation of CREB.
(A) Blocking transcription with actinomycin D (100nM) blocks Narp expression.
(B) Top: 300bp fragment upstream of the Narp transcription start site. Promoter fragment (yellow), Egr1 binding site (pink), CREB binding site (red), transcription start site (blue). Bottom: Outline of the luciferase reporter experiments.
(C) Luciferase induction after 3 and 6hrs of BDNF treatment. Increase in luciferase intensity with CREB-Egr1 and ΔEgr1 but not with ΔCREB or ΔCREB-Egr1. n=3, *p<0.05 ***p<0.001, mean ± SEM.
(D) 6-fold enrichment of pCREB on the Narp promoter after BDNF treatment, n=4, p<0.05, mean ± SEM. (E) EMSA confirmation of transcription factor binding. Gel shift observed in both untreated and BDNF treated nuclear extracts with labeled wild-type CREB oligo (lanes 2 and 5) but not with mutant oligo (lane 3 and 6) or excess unlabeled wild-type CREB oligo (lane 4 and 7). (F) Protein-DNA supershift in the presence of pCREB.

