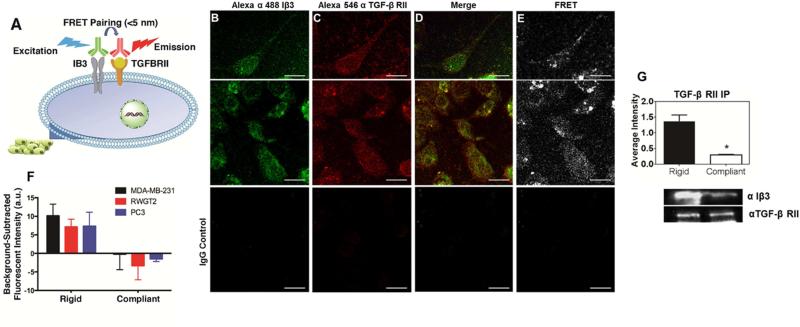
Figure 5.
Proximity of TGF-β RII and Iβ3 in MDA-MB-231 cells. (A) Schematic diagram of Förster resonance energy transfer (FRET) experiment. (B-E) 40× confocal images of cells stained with a fluorescently labeled antibody for Iβ3 subunit (Alexa 488; B), and TGF-β RII (Alexa 546; C) show colocalization (D) and a FRET response (E) of the two proteins. IgG control images show little fluorescent signal. (Scale bar = 50 μm). (E) Quantification of the FRET response of the two fluorescent antibodies reveals a significant increase of FRET expression on rigid PUR films indicating close proximity of TGF-β RII and Iβ3 subunit on the cell membrane for both MDA-MB-231-bone (black), RWGT2 (red), and PC3 cells (blue) *p<0.05. (F) Immunoprecipitation of TGF-β RII shows an association between Iβ3 and TGF-β RII on rigid surfaces.

