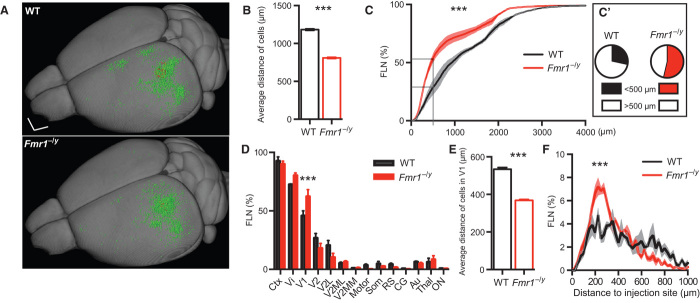
Fig. 2. Reorganization of inputs to V1 of Fmr1−/y mice.
(A) Summary image showing the localization of all retrogradely (input; green) and anterogradely (local; red) labeled neurons of all WT (upper panel; n = 3) and Fmr1−/y (lower panel; n = 3) mice within a 3D model. Scale bar, 1 mm. (B) Average distance of the retrogradely labeled cells from the injection site in Fmr1−/y and WT mice (***P < 0.0001, Mann-Whitney test). (C) The relative FLN (in percentage of total) plotted as a function of distance to the injection site indicates a significant change in the distribution (***P < 0.0001, Kolmogorov-Smirnov test). (C′) In particular, the FLN with a distance of less than 0.5 mm is increased in Fmr1−/y mice (P = 0.0242, unpaired t test). (D) FLN expressed as a function of brain area showing an increased number of local inputs (from V1) in Fmr1−/y mice compared to WT mice (P = 1.57 × 10⁻⁵, multiple t tests corrected for multiple comparisons using the Holm-Sidak method with α = 0.05). Ctx, cortical areas; Vi, visual cortex; V1, primary Vi; V2, secondary Vi; V2L, lateral V2; V2MM, mediomedial V2; V2ML, mediolateral V2; Motor, motor cortex; Som, somatosensory cortex; RS, retrosplenial cortex; CG, cingulate cortex; Au, auditory cortex; Thal, thalamus; ON, other nuclei. (E) The average distance of the local input (within V1) is decreased in the Fmr1−/y mice (P < 0.0001, Mann-Whitney test). (F) The distribution of the local input (within V1) shows that the fraction 0 to 400 μm is increased, whereas the fraction above 600-μm distance is decreased (***P < 0.0001, Kolmogorov-Smirnov test). All data are means ± SEM.

