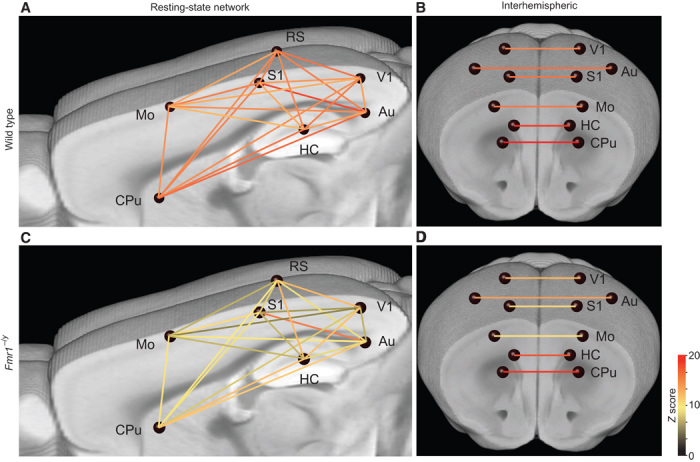
Fig. 3. Functional decoupling of neocortical brain areas in Fmr1−/y mice.

Brain graph showing the network connectivity of nodes (blue spheres) via edges (lines, color-coded for their Z score), indicating the strength of the connections. (A to D) fMRI measurements under light isoflurane anesthesia revealed a reduced functional connectivity between a number of neocortical brain areas in the Fmr1−/y (A and B; n = 7) compared to WT (C and D; n = 10) mice. In particular, the intrahemispheric connections are strongly affected (A and C), whereas the homotopic interhemispheric connectivity is only partially affected (for example, Mo-Mo; B and D). HC, hippocampus; Mo, motor cortex; S1, primary somatosensory cortex; V1, primary visual cortex; CPu, caudate putamen.
