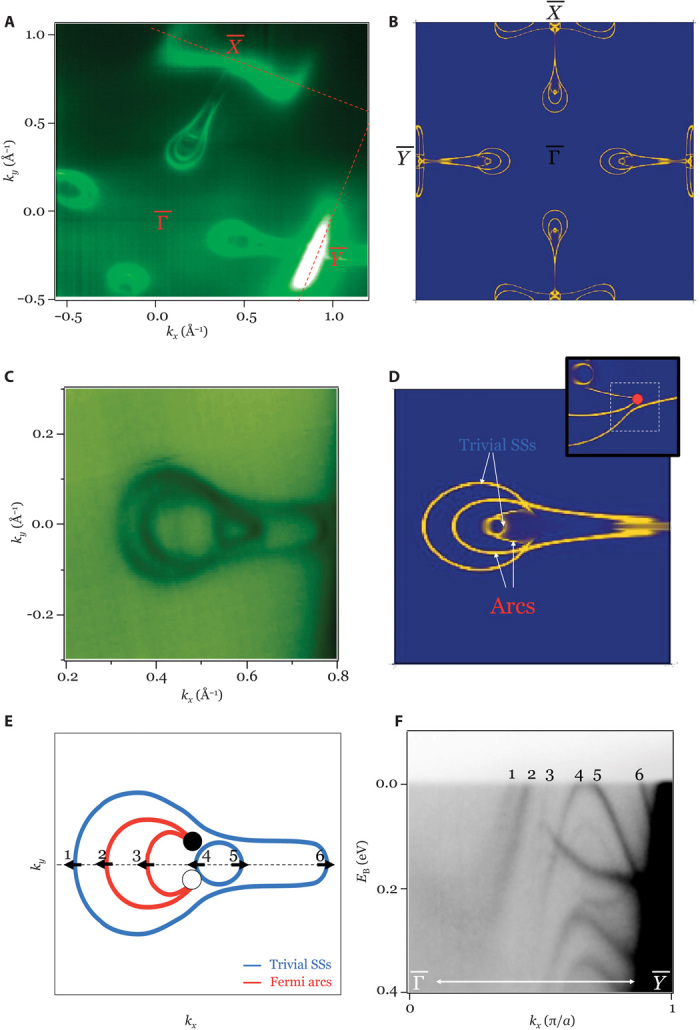
Fig. 3. Fermi arc surface states in TaP.

(A and B) ARPES-measured Fermi surface and first-principles band structure calculation of the (001) Fermi surface of TaP, respectively. (C) High-resolution ARPES Fermi surface map in the vicinity of the high-symmetry line. (D) Theoretical calculated surface Fermi surface along . The calculation used the Green function technique to obtain the spectral weight from the top two unit cells of a semi-infinite TaP system. SSs, surface states. (E) Schematic showing the Fermi arcs and the trivial surface states that correspond to our data in (C). This configuration is obtained by analyzing our ARPES data and comparing it with calculations (see the main text). (F) ARPES dispersion along the high-symmetry line. The six Fermi crossings are numbered 1 to 6. We see four states (1 to 4) with one sign of Fermi velocity and the other two (5 and 6) with the opposite sign. This is consistent with the projected chiral charge ±2 for the W2. These six states are also labeled in (E), where the arrows represent their corresponding Fermi velocity direction.
