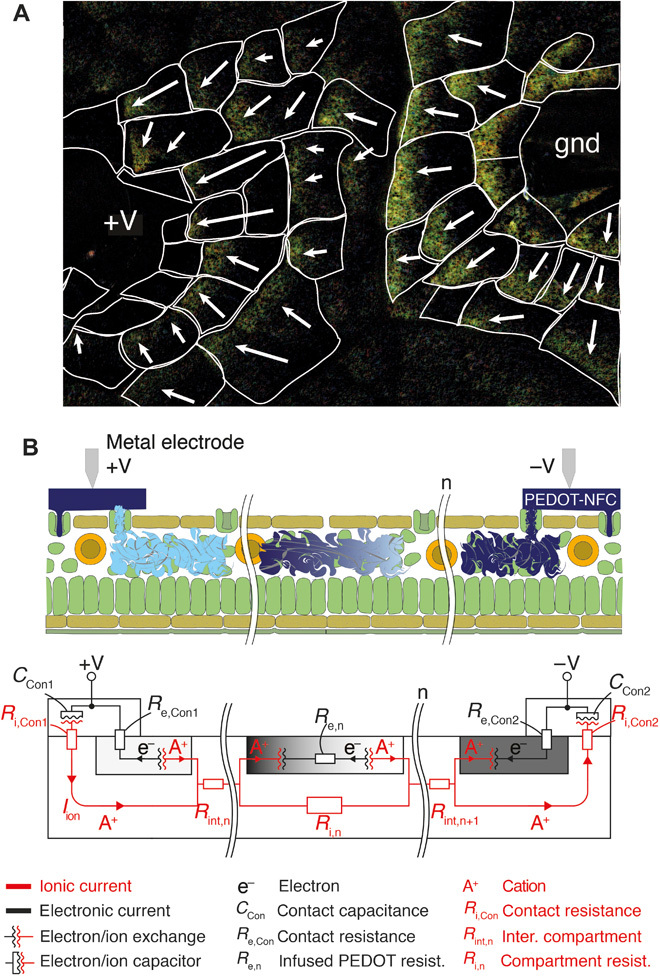
Fig. 7. Leaf OECD.

(A) Visualization of the electric field in the leaf-OECD via the induced electrochromic gradient directions [cf. study by Said et al. (30)]. (B) Electrical schematic representation of n-compartments modeling both electronic and ionic components of the current.
