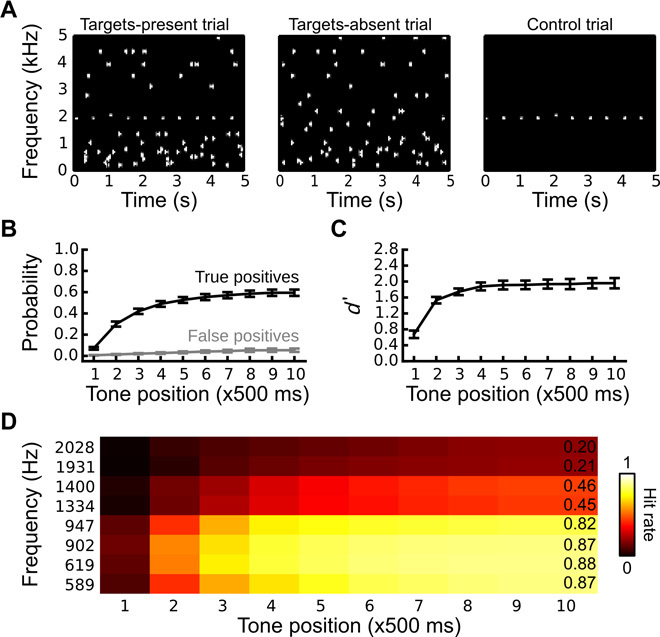
Fig. 1. Stimulation paradigm and behavioral results.

(A) Spectrographic representation of a targets-present masked trial (left), a targets-absent masked trial (middle), and an unmasked control trial (right). (B) True- and false-positive rates (that is, hits and false alarms) as a function of position within the stimulus sequence. (C) Corresponding d′. (D) True-positive rates as a function of position, binned by target frequency.
