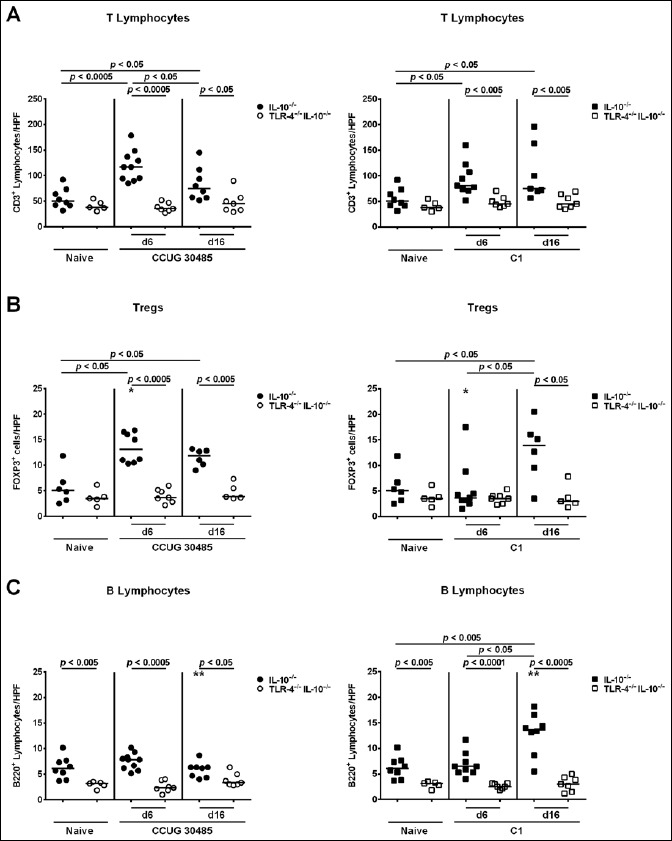
Fig. 4.

Kinetics of adaptive immune cell influx into ileal tissue of gnotobiotic TLR-4–/– IL-10–/– mice following A. butzleri infection. Gnotobiotic TLR-4–/– IL-10–/– (open symbols) and IL-10–/– mice (closed symbols) were generated by antibiotic treatment and perorally infected either with A. butzleri strain CCUG 30485 (circles; left panels) or strain C1 (squares; right panels). Uninfected mice served as negative controls (Naive). The average number of cells positive for (A) CD3 (T lymphocytes), (B) FOXP3 (regulatory T cells, Tregs), and (C) B220 (B lymphocytes) per mouse was determined microscopically in immunohistochemically stained ileal sections at days 6 or 16 p.i. Medians (black bars) and levels of significance (p-value) determined by Mann–Whitney U test are indicated. Significant differences between A. butzleri strains are indicated by stars within the graph (*p < 0.05, **p < 0.01). Data shown were pooled from three independent experiments
