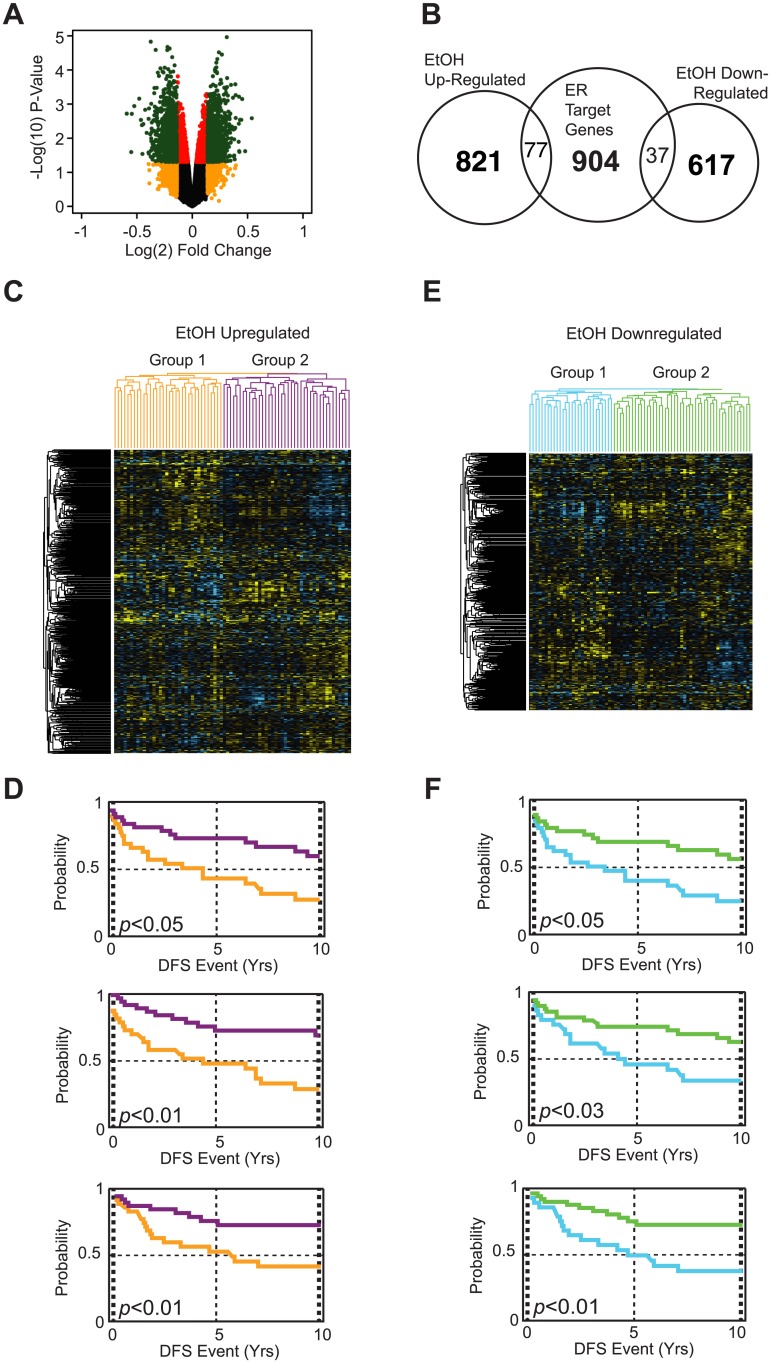
Fig 2. Gene networks regulated by alcohol treatment in MCF-7 cells are strongly correlated with breast cancer disease parameters.
(A) A representative volcano plot that depicts all probe fold changes (log2) plotted against a their false-discovery corrected p-values (log10). Probes with a +/-1.1 fold change and a p-value < 0.05 are depicted in green and are accepted alcohol-responsive genes used in downstream analysis. (B) Representative Venn diagram demonstrating the number of up-regulated and down-regulated genes, as well as the overlap of ethanol responsive genes with ER target genes. (C) Up-regulated and (D) down-regulated alcohol responsive genes were analyzed for expression in a patient microarray (Upsalla database). Yellow colors in the expression profiles indicate up-regulated genes, whereas blue colors represent down-regulated genes. Patients were then clustered into two groups based on their gene expression profiles in (C) up-regulated and (E) down-regulated gene subsets. Parameters were correlated for DFS (disease-free survival), DMFS (mestastasis-free survival), and DSS (disease-specific survival). Survival plots of subdivided patient groups show that both (D) up-regulated and (F) down-regulated alcohol responsive genes are associated with clinical parameters and disease progression. (Patient dendrograms correspond to survival plots based on color).

