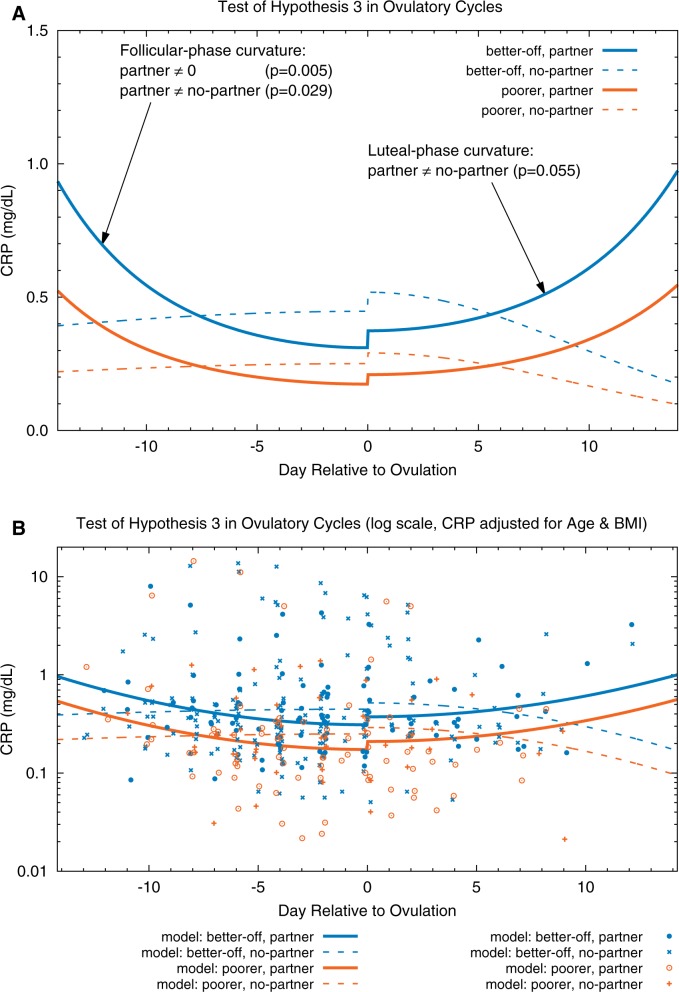
Figure 2.
Test of Hypothesis 3 in ovulatory cycles. (A) Fitted models. (B) Fitted models and CRP data (adjusted for age and BMI) plotted on a log scale; adjusted CRP = exp(ln(observed CRP) − beta_age*(Centered_Age) − beta_BMI*(Centered_BMI)); data points are randomly dithered (slightly offset) on x-axis for ease of viewing. Interaction between partnership status, SES and cycle day predicted CRP in ovulatory cycles. CRP is significantly higher during the early follicular and late luteal phases (P = 0.029 and 0.055, respectively) in partnered (solid curves) than in unpartnered (dashed curves) women. In partnered cycles, CRP is lower around ovulation than at the cycle’s beginning (fitted model curvature is significant at P = 0.005). In contrast to partnered women, CRP in the ovulatory cycles of unpartnered women is more stable over time (fitted model curvature is not significantly different from 0). The small increases in CRP at ovulation are not statistically significant in these models

