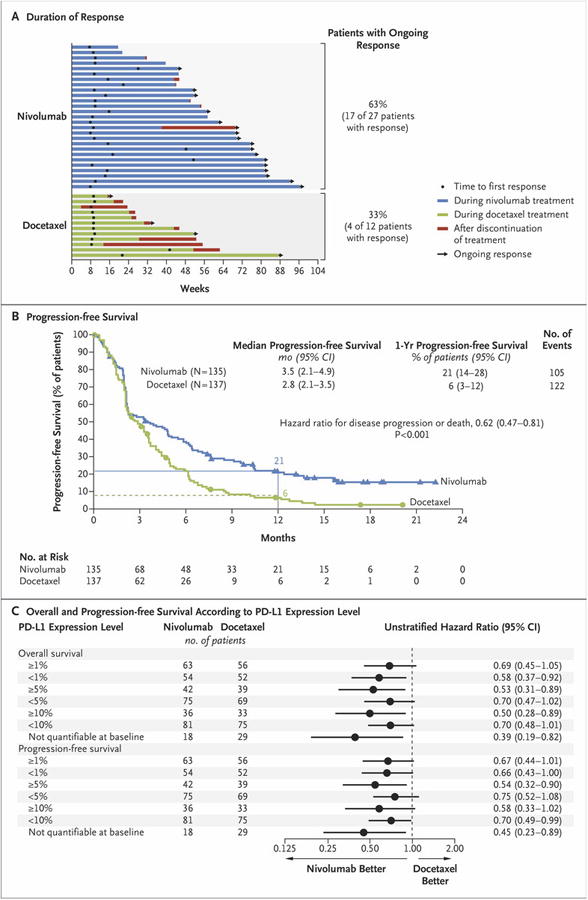
Figure 2. Efficacy of Nivolumab versus Docetaxel in Patients with Advanced Squamous-Cell Non–Small-Cell Lung Cancer.

Panel A shows the characteristics of response and disease progression as assessed by the investigator, according to the Response Evaluation Criteria in Solid Tumors, version 1.1. Bars indicate the duration of response. Arrows indicate ongoing response at the time of data censoring. Panel B shows the Kaplan–Meier curves for progression-free survival, defined as the time from randomization to the date of the first documented event of tumor progression, death, or last tumor assessment that could be evaluated (data-censoring date). The analysis included all the patients who underwent randomization. Symbols indicate censored observations, and the horizontal lines the rates of progression-free survival at 1 year. Panel C shows the plot of hazard ratios for death (in the analysis of overall survival) and death or disease progression (in the analysis of progression-free survival), according to the level of expression of the ligand for programmed death 1 (PD-L1) at baseline. The prespecified expression levels for the PD-L1 biomarker analysis were 1%, 5%, and 10% of cells in a section with at least 100 tumor cells that could be evaluated.
