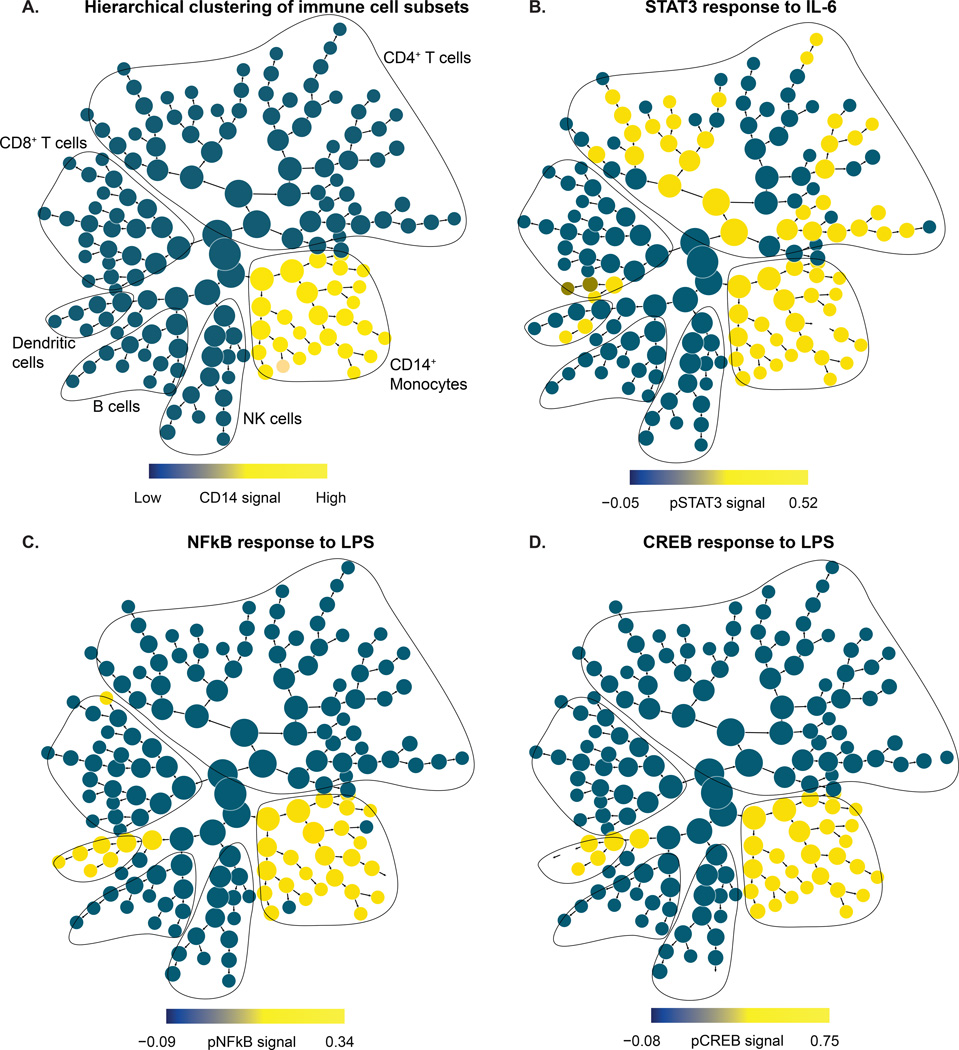
Figure 2. Evoked signaling responses in pre-surgical whole blood samples.
(A) The cluster hierarchy plot represents immune cell subsets across the entire peripheral immune system. The cluster hierarchy plot is annotated and contoured based on the expression of canonical lineage markers indicative of major immune cell subsets. As an example, the monocyte branch is highlighted in yellow based on the expression of the cell surface marker CD14. (B) STAT3 (phosphorylated signal transducer and activator of transcription 3) signaling response to IL-6 (interleukin 6): Individual clusters are colored based on the median signal induction of pSTAT3. A significant response was evoked in CD14+ monocytes, dendritic cells, CD4+ T cells, and a small fraction of CD8+ T cells. (C) NFκB (phosphorylated nuclear factor kappa-light-chain-enhancer of activated B cells) signaling response to LPS (lipopolysaccharide): Individual clusters are colored based on the median signal induction of pNFκB. A significant response was evoked in CD14+ monocytes and dendritic cells. (D) CREB (phosphorylated cAMP response element-binding protein) signaling response to LPS: Individual clusters are colored based on the median signal induction of pCREB. A significant response was evoked in CD14+ monocytes and dendritic cells.

