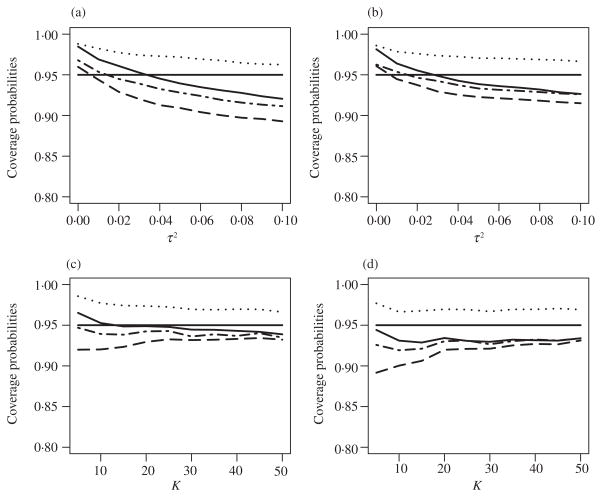
Fig. 3.
Empirical coverage probabilities of nominal 95% confidence intervals when the random effects are from the τ × Ga(1, 1) distribution centred at its mean, plotted against τ2 for (a) K = 10 and (b) K = 20, and plotted against K for (c) τ2 = 0·03 and (d) τ2 = 0·07. In each panel, the different curves correspond to the new resampling method (solid), the DerSimonian–Laird method (dashed), the Jackson–Bowden method (dotted), and the Hardy–Thompson method (dot-dash).

